XM does not provide services to residents of the United States of America.

Technical Analysis

Technical Analysis – AUDUSD struggles to extend dip below 200-SMA

Posted on July 1, 2021 at 9:03 am GMT

AUDUSD’s fresh plunge beneath its 200-day simple moving average (SMA) seems to have lost its power again, just shy of the support barricade of 0.7372-0.7461. That said, the 50- and 100-day SMAs are starting to turn downwards, endorsing negative price action, while the Ichimoku lines are suggesting bearish sentiment may soon pick up. Currently, the short-term oscillators are promoting a bearish demeanour; however, it remains to be seen whether it is sustainable. The MACD is slightly underneath its red trigger [..]
Technical Analysis – USDCHF revives bullish correction; nears overbought zone

Posted on July 1, 2021 at 7:15 am GMT

USDCHF sped up to close above the 50% Fibonacci of the latest downfall at 0.9200 and on top of the Ichimoku cloud on Wednesday. The 61.8% Fibonacci of 0.9297 is the next target as the positive slope in the RSI and the Stochastics and the strengthening momentum in the MACD foresee additional bullish extensions in the near term. That said, the RSI and the Stochastics are currently hovering near overbought levels, suggesting that room for improvement could be limited. Perhaps, [..]

post-image

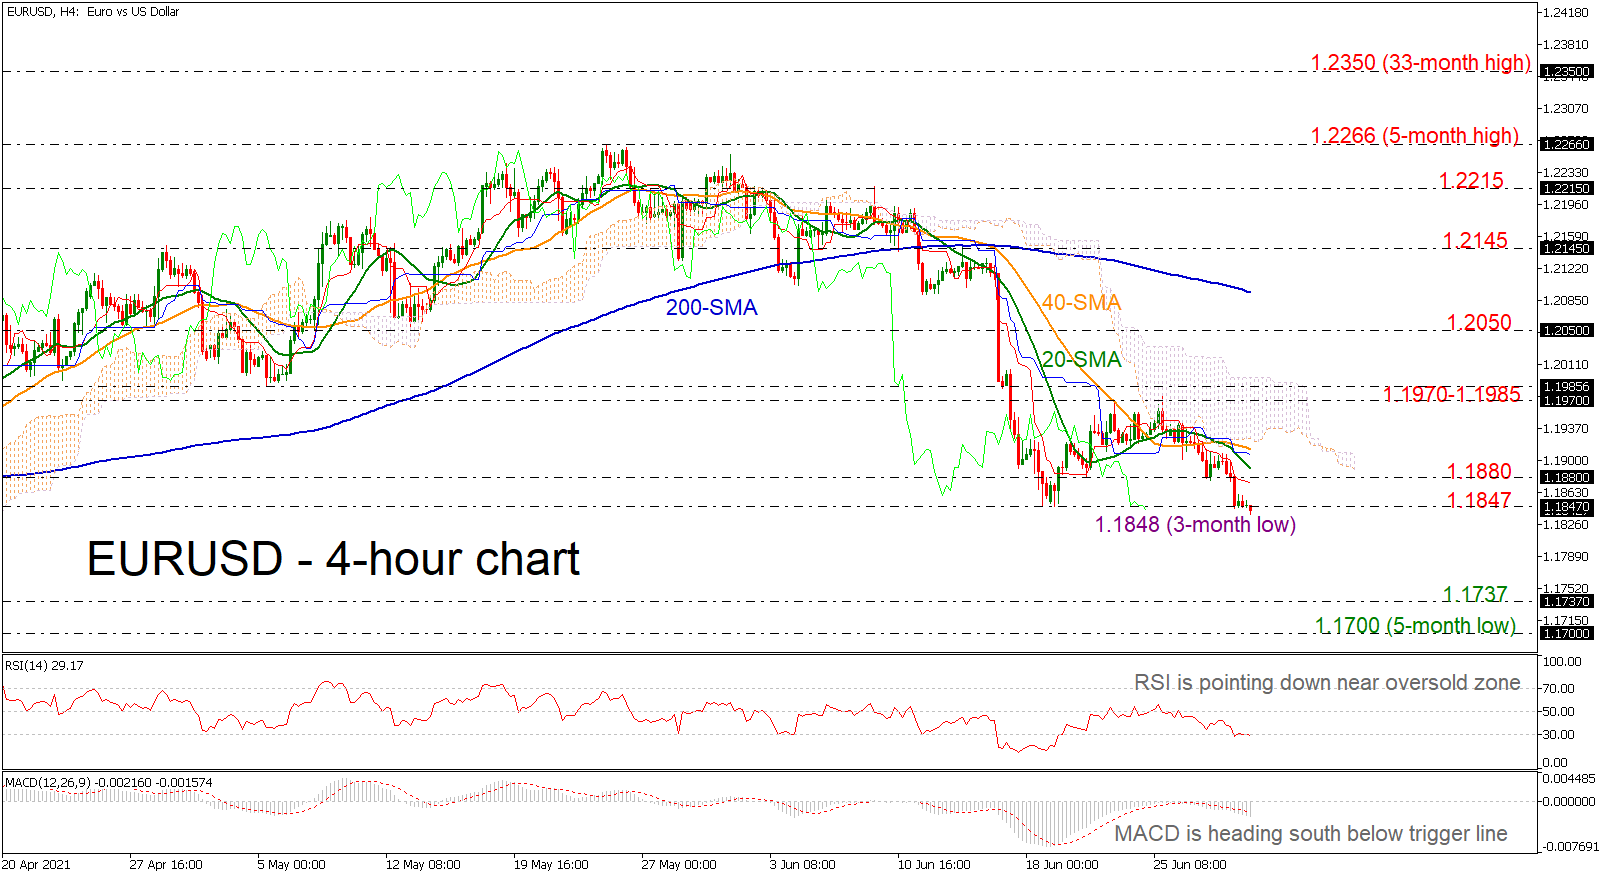
Technical Analysis – EURUSD completes new 3-month low around 1.1850

Posted on July 1, 2021 at 6:16 am GMT

EURUSD has been heading south over the last few sessions, remaining well below the 1.1900 round number. The 20- and 40-period simple moving averages (SMAs) posted a bearish crossover, mirroring the recent action on price. The RSI is moving south near the oversold territory, while the MACD is extending its bearish movement beneath its trigger and zero lines. If sellers drive the pair lower, the 1.1737 support level could interrupt the bears ahead of the five-month low of 1.1700. To [..]

post-image

Technical Analysis – EURJPY stabilizes, as bearish forces’ reign questioned

Posted on July 1, 2021 at 6:07 am GMT

EURJPY in previous sessions bounced in the neighbourhood of the 131.21 low and the 61.8% Fibonacci retracement of the up leg from 129.58 until 134.12, but bullish price action was quickly curbed at the 50-period simple moving average (SMA) around 131.80. While the fresh bearish crossovers of the 200-period SMA are aiding a deteriorating picture, the easing of the 50-period SMA’s downward slope is conveying some doubt in the potency of negative sentiment. The Ichimoku lines are indicating a pause [..]

post-image

Technical Analysis – GBPJPY still largely neutral as negative pressures grow

Posted on June 30, 2021 at 2:18 pm GMT

GBPJPY has found some footing in the vicinity of the 50.0% Fibonacci retracement of the up leg from 149.04 until 156.06, after the price was redirected beneath the simple moving averages (SMAs) and the Ichimoku cloud. The recent bearish crossovers of the 200-period SMA are endorsing the extension of the deflection off the minor descending trend line, pulled from the 156.06 peak. That said, the negative slope of the 50-period SMA is starting to ease, signalling some suspicion in the [..]

post-image

Technical Analysis – EURGBP soars in downward sloping channel near 0.86

Posted on June 30, 2021 at 8:48 am GMT

EURGBP is forming an upside rally, following the bounce off the 0.8530 support area. However, the market has been developing within a descending channel since April 26 and a strong boost may penetrate this pattern to the upside in the next few sessions. The RSI is flirting with the 50 level to gain some momentum, though, the stochastic is suggesting a potential downside pullback as it turns down from the overbought region. If price action climbs above the 0.8600 number, [..]

Technical Analysis – NZDUSD erases last week’s gains but some hopes glimmer

Posted on June 30, 2021 at 8:15 am GMT

NZDUSD could not find enough buyers to overcome the 0.7100 level last week, with the spotlight shifting again towards the new 7-month low of 0.6921 following the close below the simple moving averages (SMAs). Encouragingly however, the RSI and the MACD continue to hold above their recent lows, while the latter has also managed to crawl back above its red signal line, providing some optimism that the bulls may not give up the battle yet. The 0.7072 number, where the 20- [..]

Technical Analysis – USDJPY struggles to close above 1-year high of 110.96

Posted on June 30, 2021 at 7:25 am GMT

USDJPY is finding its feet at the red Tenkan-sen line at 110.41 after fading from its latest clocked 15-month high of 111.11. The two-month positive structure’s bullish defences are becoming clearer now with the pair shaping higher lows and highs above the rising simple moving averages (SMAs). The Ichimoku lines are indicating that bullish momentum is taking a breather, while the short-term oscillators are transmitting mixed signals in relation to the price’s directional preference. The MACD is above zero and [..]

post-image

Technical Analysis – Gold holds near 2½-month low; bearish bias  

Posted on June 30, 2021 at 7:03 am GMT

Gold prices reached a fresh two-and-a-half-month low of 1,750 on Tuesday, driving the market in a bearish tendency. The 20- and 40-period simple moving averages (SMAs) are heading slightly south as well as the Ichimoku lines in the 4-hour chart. Looking at the technical indicators, the RSI is moving lower in the negative territory, confirming the recent downside move; however, the stochastic oscillator is trying to recoup some ground, jumping above the oversold region. If the price continues the selling [..]

post-image

Technical Analysis – USDCAD buyers struggle to reach 1.24 handle

Posted on June 29, 2021 at 3:34 pm GMT

USDCAD’s recent positive momentum has managed to steer the pair above the Ichimoku cloud and the 1.2373 level, which happens to be the 23.6% Fibonacci retracement of the up leg from 1.2006 until 1.2486. The simple moving averages (SMAs) are endorsing positive price action, while the Ichimoku lines are reflecting a growing bullish tone. The short-term oscillators are reflecting a pickup in bullish drive and are reflecting a preference in the price to steer higher. The MACD is rising above [..]

Risk Warning: Your capital is at risk. Leveraged products may not be suitable for everyone. Please consider our Risk Disclosure.