XM does not provide services to residents of the United States of America.

Technical Analysis

post-image

Technical Analysis – EURUSD hovers in declining channel with flat momentum

Posted on July 15, 2021 at 8:50 am GMT

EURUSD has been travelling in a downward sloping channel since June 17, standing around the 20- and 40-period simple moving averages (SMAs). The RSI is moving horizontally around its mid-level; however, the MACD is still developing above its trigger line in the negative region. Following a successful decline below the SMAs, the 1.1767 barrier could provide immediate support before meeting the lower surface of the declining channel at 1.1737. Further down, the five-month low of 1.1700 could serve as a [..]

Technical Analysis – WTI futures recoil below Ichimoku lines

Posted on July 15, 2021 at 8:27 am GMT

WTI oil futures’ upside momentum is looking feeble as the price of the commodity retreated beneath the Ichimoku lines for a second time, ever since logging a 33-month peak just shy of the 77.00 handle. That said, the steadily advancing simple moving averages (SMAs) are defending the broader uptrend, while the flattening Ichimoku lines are indicating dwindling in the price’s bullish drive. The short-term oscillators are suggesting negative momentum is gaining pace. The MACD, in the position zone, is deviating [..]

Technical Analysis – AUDUSD tries to gain ground in near term

Posted on July 15, 2021 at 7:14 am GMT

AUDUSD is battling the 20-day simple moving average (SMA) to create more gains, though the price is still holding above the 0.7405 support level. The RSI indicator is pointing upwards in the negative territory, while the MACD is surpassing its trigger line in the bearish zone. However, the pair is hovering well below the Ichimoku cloud and the red Tenkan-sen and blue Kijun-sen lines. If the price overcomes the 20-day SMA, immediate resistance could come from the 200-day SMA at 0.7585 ahead of [..]

post-image

Technical Analysis – Gold advances under strain as 200-MA applies the brakes

Posted on July 14, 2021 at 2:58 pm GMT

Gold’s recent surge in positive impetus has been capped by the 200-period simple moving average (SMA) at 1,829. Sellers seem to have gained the upper hand, steering the price back underneath the 1,825 level (previous resistance-now-support). In spite of the downward bearing of the 200-period SMA, the bullish 50- and 100-period SMAs continue to underpin the commodity’s recent progress. The Ichimoku lines are indicating feeble upward drive, while the short-term oscillators are conveying mixed signals in directional momentum. The MACD [..]

post-image

Technical Analysis – EURGBP completes red days around 0.8500

Posted on July 14, 2021 at 1:36 pm GMT

EURGBP is creating a bearish move in a downward sloping channel, which has been holding since April 26 and any further falls in the next sessions could pierce this pattern to the downside. The RSI has dropped below the neutral 50 mark, while the stochastic has remained in the oversold zone. More aggressive losses could take the market until the 13-month low of 0.8470 before heading towards the 0.8280 support, taken from the low on February 16. The 20- and [..]

Technical Analysis – NZDUSD stabilizes below 200-MA; negative pressures endure

Posted on July 14, 2021 at 11:03 am GMT

NZDUSD is ranging around the 0.7000 hurdle ever since the pair manoeuvred below the 200-day simple moving average (SMA). Although the pair is exhibiting a slight negative preference, buyers are currently labouring to return back above the 0.7000 mark. Endorsing negative price tendencies are the converged 50- and 100-day SMAs, which are dipping, and are looking positioned to complete a bearish overlap of the 200-day SMA. The negatively charged Ichimoku lines are also gliding lower, signalling that sellers are still [..]

post-image

Technical Analysis – CADJPY points to trend deterioration

Posted on July 14, 2021 at 8:52 am GMT

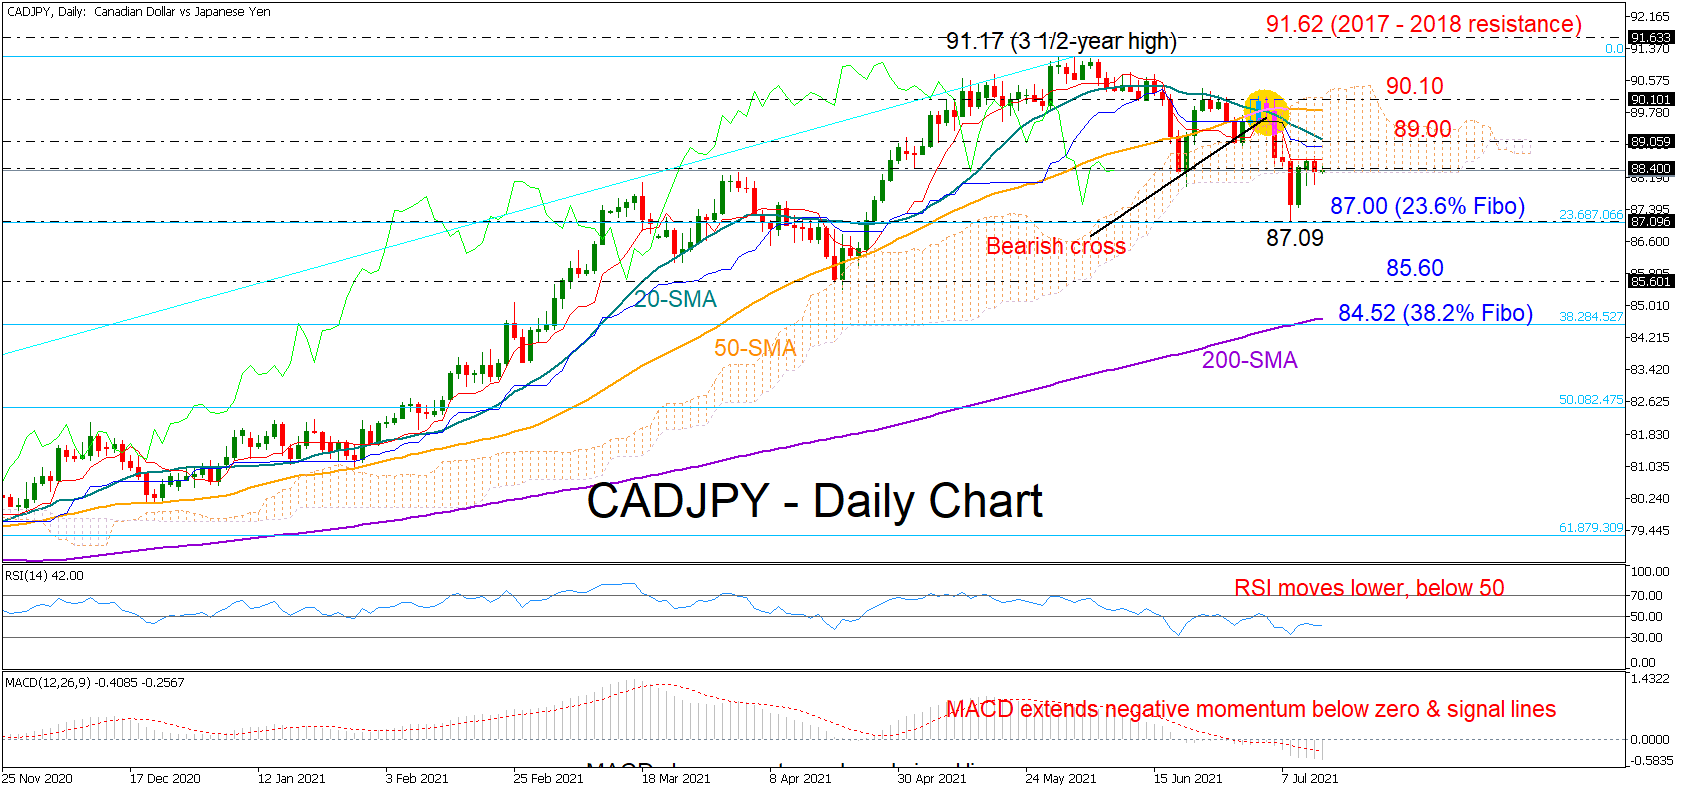
CADJPY stretched the downfall from the 91.17 top to a fresh low of  87.09 last week, downgrading the outlook in the short-term picture. The recent intersection between the 20- and 50-day simple moving averages (SMAs), which is the first since September 2020, is endorsing the bear turn in market trend. This week, the pair managed to pare some losses but the red Tenkan-sen line is currently blocking the way higher at 88.64, questioning how long the bulls could persist. The downside reversal [..]

post-image

Technical Analysis – EURCHF bounces around 1.08 but downside risks persist

Posted on July 14, 2021 at 7:25 am GMT

EURCHF is overstepping the July 8 low of 1.0824 (previous support-now-resistance) after buyers found their feet around the 1.0800 handle. Nevertheless, the diving simple moving averages (SMAs) and the recently completed bearish crossovers of the 200-period SMA by the 50- and 100-period SMAs are reinforcing the declining price formation. The Ichimoku lines are suggesting a temporary pause in downward forces with the recent price bounce off the near five-month low of 1.0798. The short-term oscillators are transmitting conflicting signals in [..]

Technical Analysis – USDJPY fails to beat 20-day SMA; holds in ascending channel

Posted on July 14, 2021 at 6:48 am GMT

USDJPY is facing strong resistance at the 20-day simple moving average (SMA) near 110.60, looking set for a red session after three consecutive green days.  Previously, the 23.6% Fibonacci retracement level of the up leg from 102.60 to 111.65 at 109.50 managed to defend the bulls, holding the price within an ascending channel. Looking at the technical indicators, the RSI is pointing south, ready to cross back below its 50 neutral mark, while the MACD is losing momentum in the positive region. If the pair successfully jumps above the [..]

post-image

Technical Analysis – WTI futures advancing above SMAs; indicators suggest bullish bias

Posted on July 13, 2021 at 12:08 pm GMT

WTI crude oil futures found strong support at the 73.16 support, which overlaps with the 20-period simple moving average (SMA). The price is trying to recoup some previous losses with the MACD gaining some ground above its trigger and zero lines. Also, the RSI is pointing slightly up above the 50 level. If the price continues the upside move, the next target could come from the 74.90 barrier before meeting the six-and-a-half-month high of 76.96. In the negative scenario, a [..]

Risk Warning: Your capital is at risk. Leveraged products may not be suitable for everyone. Please consider our Risk Disclosure.