XM does not provide services to residents of the United States of America.

Technical Analysis

post-image

Technical Analysis – EURUSD develops in descending channel; hovers near 1.1800

Posted on July 22, 2021 at 8:00 am GMT

EURUSD has been holding in a descending channel since June 16 and is currently attempting to climb above the short-term simple moving averages (SMAs) near the 1.1800 round number. An increase beyond the downward sloping pattern could take the market towards the 1.1880 resistance and the 200-period SMA at 1.1927. The technical indicators are confirming the recent bullish movement. The RSI is heading north above the neutral threshold of 50, while the MACD is holding above its trigger line and [..]

Technical Analysis – WTI oil futures power up to 70 but some caution remains

Posted on July 22, 2021 at 6:56 am GMT

WTI oil futures (September delivery) bounced forcefully near the critical resistance-turned-support zone of 66.65 late on Wednesday, quickly recouping most of Monday’s losses to trade back above the 70.00 level. The sprint saved the marked from an outlook deterioration in the medium-term picture, but in the short-term window, the price is still structurally in a bearish corrective mode below the 76.20 peak. As regards the price momentum, although the upside reversal in the Stochastics is promoting further recovery in the [..]

post-image

Technical Analysis – GBPJPY powers up as negative risks endure     

Posted on July 21, 2021 at 3:53 pm GMT

GBPJPY has pushed over the 150.65 barrier and is making efforts to test the resistance band of 151.30-151.60. The falling simple moving averages (SMAs) are defending the broader bearish move, while the uptick in the red Tenkan-sen line is suggesting robust buying interest off the four-and-a-half-month bounce. The short-term oscillators are indicating growing upside momentum, although the bearish structure still maintains the upper hand. The MACD below zero is improving above its red trigger line, while the upward pointing RSI [..]

post-image

Technical Analysis – Gold dives further, tests 1,800 level

Posted on July 21, 2021 at 12:38 pm GMT

Gold has been falling hard in recent sessions, slipping below the crucial levels such as the 38.2% Fibonacci retracement level of the down leg from 1,916 to 1,750 at 1,813 and the short-term SMAs as well as the key 1,800 barrier. The stochastic oscillator is holding in the oversold region, while the RSI is extending its bearish structure in the negative area. If the price dips further, immediate support could come from the 23.6% Fibonacci of 1,790 before plunging towards the two-and-a-half-month low of 1,750, [..]

post-image

Technical Analysis – USDJPY extends bounce at 109 above SMAs

Posted on July 21, 2021 at 9:17 am GMT

USDJPY has managed to find a foothold around the 109.00 handle, lifting the price back above the simple moving averages (SMAs) and the 110.00 hurdle. The persistent bullish bearing in the SMAs is nurturing the positive structure, in spite of the retracement in the pair. That said, the active negative charge in the Ichimoku lines is endorsing the pullback from the 15-month high of 111.65 but the sideways bearing of the blue Kijun-sen line suggests buyers are countering downside pressures. [..]

post-image

Technical Analysis – NZDUSD forms a bearish move near 8-month low

Posted on July 21, 2021 at 7:15 am GMT

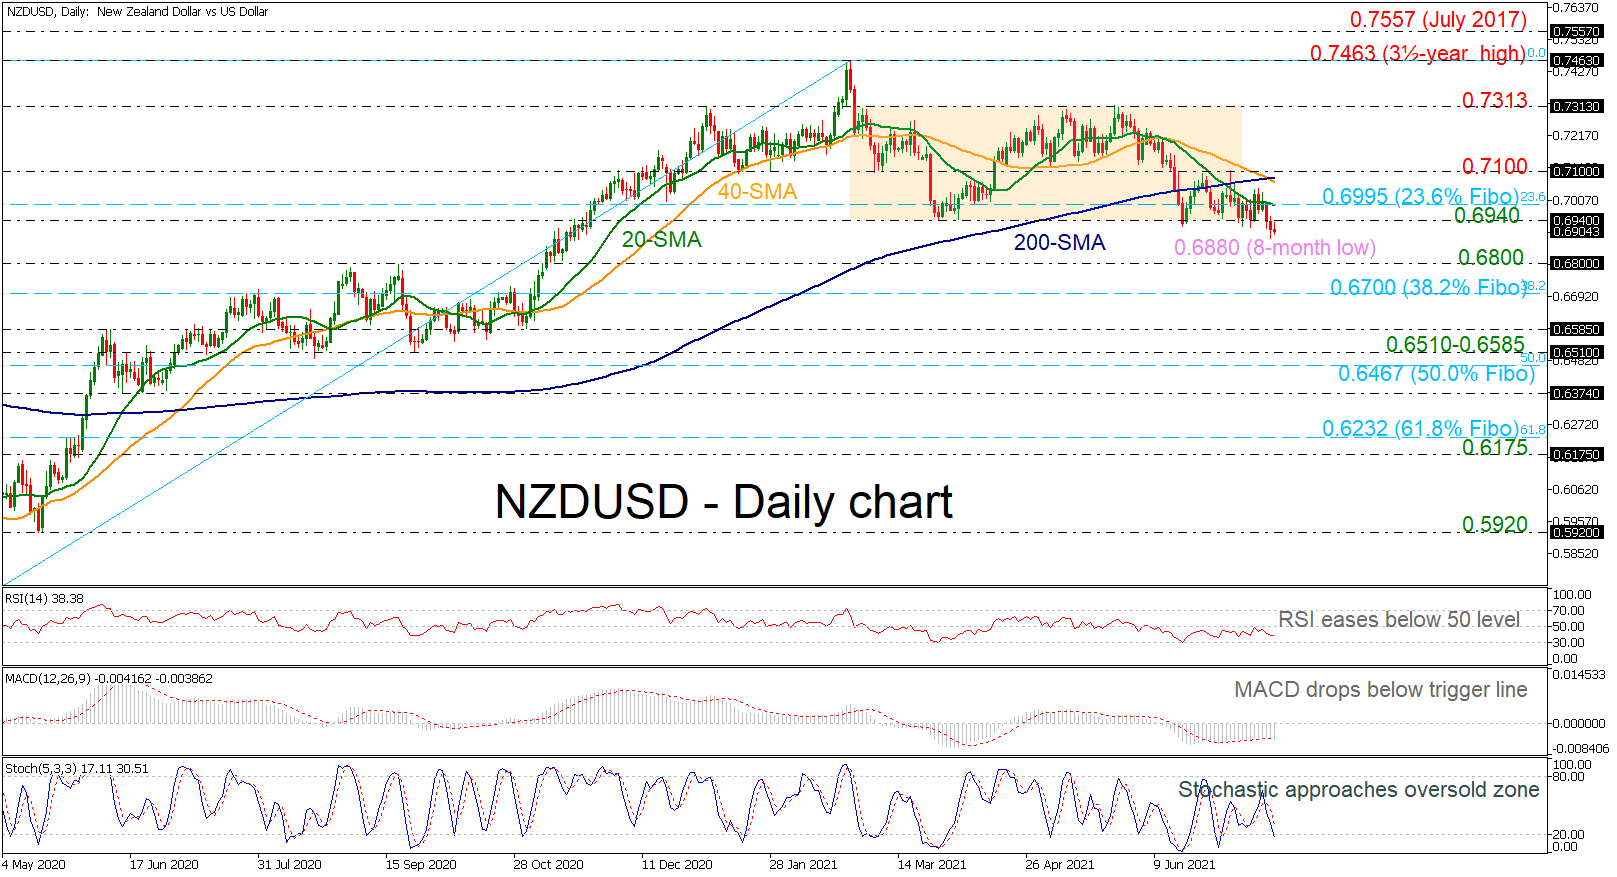
NZDUSD plummeted to a fresh eight-month low at 0.6880 on Tuesday, breaking below the sideways channel that had been holding since February 26. The 40-day simple moving average (SMA) crossed the 200-day SMA to the downside, indicating more losses in the near term. The RSI and the MACD are slipping in the negative territories and the stochastic oscillator is entering the oversold zone. More downside moves could take the market towards the 0.6800 psychological number ahead of the 38.2% Fibonacci [..]

Technical Analysis – EURCHF aims for a rebound as bearish trend jitters strengthen

Posted on July 21, 2021 at 6:51 am GMT

EURCHF paused again around the bottom of the four-month-old descending channel following the slump below the long-term supportive trendline and the dip towards a five-month low of 1.0789. The ongoing consolidation could precede another upside reversal and the positive charge in the RSI and the Stochastics, which are deviating above their oversold levels, is endorsing that bullish scenario. The bearish part of the story, however, is that the plunge below the trendline and the progressing negative cross between the 20- [..]

post-image

Technical Analysis – USDCAD consolidates above 1.27 level; positive tone intact

Posted on July 20, 2021 at 3:48 pm GMT

USDCAD has stabilized above the 1.2729 low after aggressively stretching to a five-and-a-half-month high of 1.2807. The advancing simple moving averages (SMAs) are shielding recent improvements in the pair, while the bullish Ichimoku lines are indicating a pause in upward drive, specifically the flattening of the blue Kijun-sen line. The short-term oscillators are currently reflecting a slight dry up in positive momentum. The MACD, far above zero, is north of but is edging towards its red trigger line, while the [..]

post-image

Technical Analysis – WTI oil futures get squeezed within key area after slump

Posted on July 20, 2021 at 10:06 am GMT

WTI oil futures (September delivery) experienced the worst one-day loss since September on Monday, falling more than 2.0% to end below the 70.00 mark and near a two-month low of 65.54. The freefall brought the 61.8% Fibonacci retracement of the 61.54 – 76.20 upleg at 66.20 straight under the spotlight. Given the RSI’s dip in the oversold area, which is the longest in more than a year, and the upturn in the Stochastics, an upside correction could take shape in the [..]

Technical Analysis – GBPUSD dives beyond 200-MA and key troughs

Posted on July 20, 2021 at 8:44 am GMT

GBPUSD has slipped underneath the 200-day simple moving average (SMA) at 1.3707 and the March and April troughs at 1.3669, strengthening a bearish notion as it surrenders extra ground. The dipping 50- and 100-day SMAs are giving the impression that bearish forces are seizing command. The Ichimoku lines are indicating that downside risks are persisting, while the short-term oscillators are suggesting the pair may remain heavy for a little while longer. The MACD below zero has nudged back beneath its [..]

Risk Warning: Your capital is at risk. Leveraged products may not be suitable for everyone. Please consider our Risk Disclosure.