XM does not provide services to residents of the United States of America.

Technical Analysis

Technical Analysis – USDJPY maintains sideways trajectory below broken trendline

Posted on July 28, 2021 at 7:30 am GMT

USDJPY was capped by the 20-day simple moving average (SMA) around the 110.40 resistance area on Tuesday, with the price pulling back to seek support near the 109.73 number once again. Previously, the crack below the long-term trendline forced the price into a sideways trajectory as the bounce at the bottom of the Ichimoku cloud at 109.05 withered the potential of sharper declines. With the RSI swinging around its 50 neutral mark and the MACD holding muted around its zero and signal lines, [..]

Technical Analysis – NZDUSD remains below 23.6% Fibonacci and falling line

Posted on July 28, 2021 at 6:47 am GMT

NZDUSD has been in a declining mode after the pullback off the three-and-a-half-year high of 0.7463, sending the price beneath the 23.6% Fibonacci retracement level of the up leg from 0.5470 to 0.7463 at 0.6995. However, the RSI is mirroring the latest rising move and is pointing upwards near the neutral threshold of 50, while the MACD is extending its positive bias above its trigger line. The 0.7000-0.7100 area, where the 20- and 200-day SMAs reside, could challenge any bullish [..]

post-image

Technical Analysis – Facebook stock recedes from all-time high of 375

Posted on July 27, 2021 at 3:41 pm GMT

Facebook stock has retreated below the 369.00 support after aggressive traction off the 100-period simple moving average (SMA) catapulted the price to a fresh all-time high of 375.00. The advancing SMAs are shielding the short-term bullish structure, endorsing the upside. However, the Ichimoku lines are indicating that positive drive is temporarily stalled, while the short-term oscillators are suggesting that sellers may be starting to gain a slight advantage.  The MACD’s incline is slowing far above its red trigger line in [..]

post-image

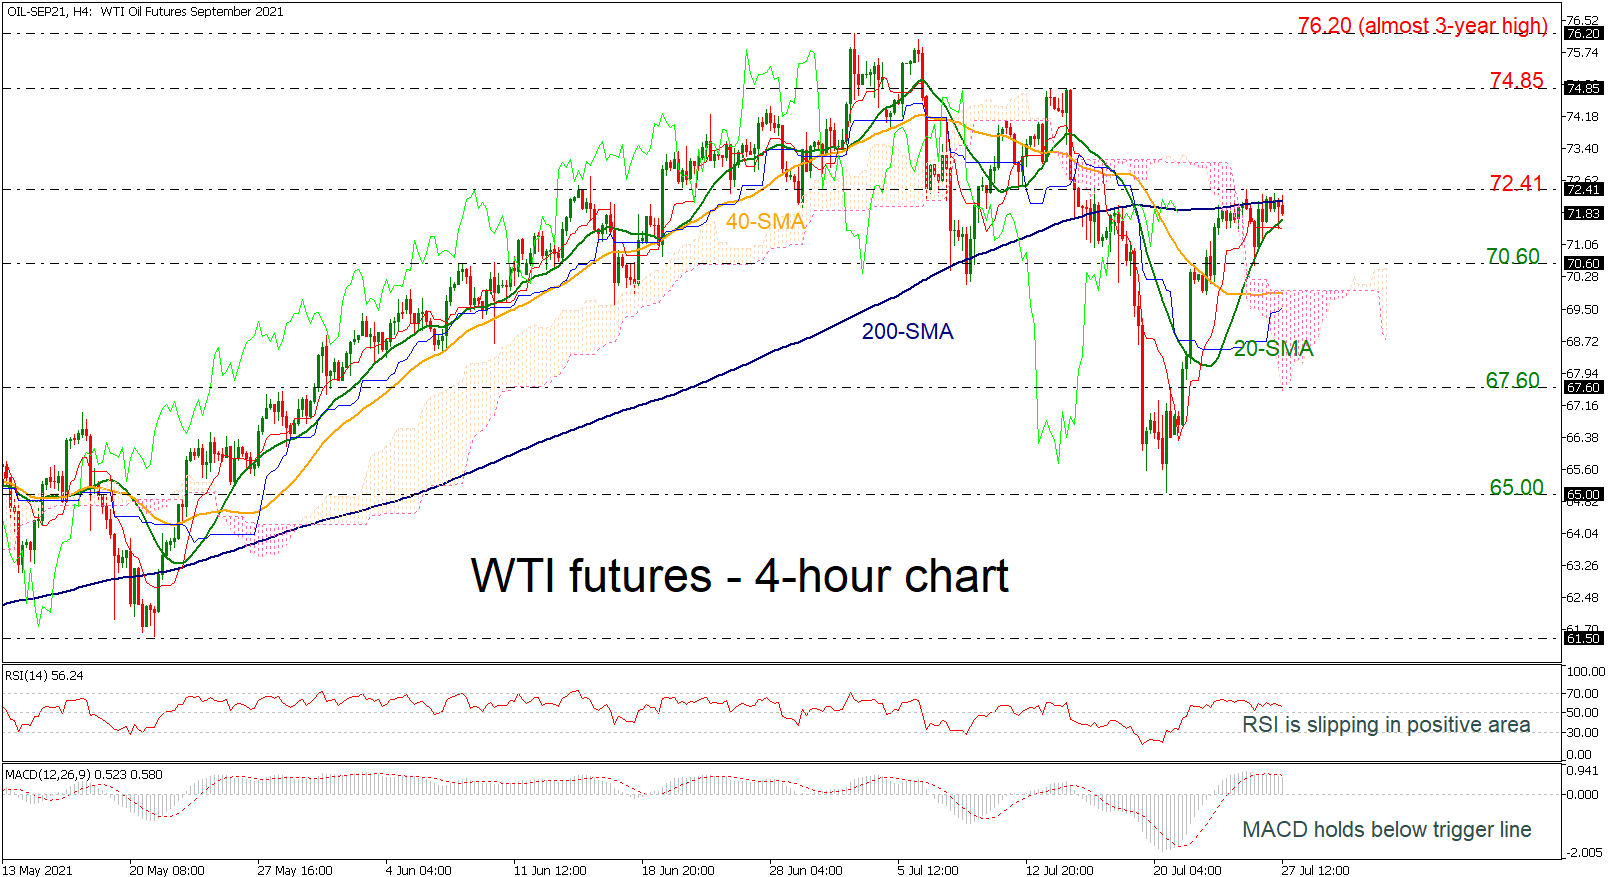
Technical Analysis – WTI futures struggle to surpass 200-period SMA

Posted on July 27, 2021 at 12:50 pm GMT

WTI crude oil futures are moving sideways, finding strong resistance at the 200-period simple moving average (SMA) and support at the 20-period SMA. The RSI indicator is falling in the positive region, while the MACD is losing momentum in the bullish region. Both are suggesting that a potential downside pullback may be on the cards in the next sessions. A successful attempt below the short-term SMA could send the price towards the 70.60 support and the upper surface of the [..]

post-image

Technical Analysis – USDCAD finds traction off 100-SMA and faces instant barrier  

Posted on July 27, 2021 at 10:17 am GMT

USDCAD is confronting an immediate resistance zone from a line-up of recent familiar highs around 1.2587 until the Ichimoku cloud’s lower surface at 1.2615. The advancing simple moving averages (SMAs) are defending the short-term upside structure, in spite of the price pullback from the 5½-month high of 1.2807. The consolidation in the price after the plunge is showing that downside pressures have somewhat subsided, as the pair acquires some footing off the 100-period SMA as well. The stance in the [..]

post-image

Technical Analysis – Apple stock holds in bullish territory; next target 150.00

Posted on July 27, 2021 at 7:38 am GMT

Apple stock price is gaining momentum above the Ichimoku lines, holding around the record high of 149.86. The strong bullish structure has been holding since May 30 and the 50- and 200-day simple moving averages (SMAs) are pointing upwards. The RSI indicator is heading towards the overbought region; however, the MACD is flattening below its trigger line in the positive area.   Immediate resistance could come from the 149.86 level before inserting into uncharted levels such as 150.00, 151.00 and [..]

Technical Analysis – GBPUSD waits for a channel breakout

Posted on July 27, 2021 at 7:27 am GMT

GBPUSD extended its recovery from a 5 ½-month low of 1.3570 marginally above the 1.3800 level and the 20-day simple moving average (SMA) on Monday but another obstacle has emerged. The price is currently battling the surface of a descending channel and the 38.2% Fibonacci retracement of the latest downfall at 1.3829. Should efforts prove fruitful, the door would open for the 50% Fibonacci of 1.3900, while within breathing distance, the 50-day SMA at 1.3952 may cancel any corrections towards the 61.8% Fibonacci [..]

Technical Analysis – EURJPY rebounds off 200-day SMA, meeting 130.00

Posted on July 27, 2021 at 6:29 am GMT

EURJPY is declining somewhat today after the bounce off the 128.55 support level and the 200-day simple moving average (SMA), visiting the 130.00 round number again. The price is still developing below the short-term SMAs and the RSI indicator is suggesting a potential pullback as it is pointing down in the negative territory. However, the stochastic oscillator is gaining momentum in the overbought region. More descending moves could take the market until the immediate support of the 38.2% Fibonacci retracement [..]

post-image

Technical Analysis – US 500 index stretches to fresh record high of 4,415

Posted on July 26, 2021 at 1:37 pm GMT

The US 500 stock index (Cash) is ticking back up after a minor pullback from its recently reached all-time high of 4,415. The positively charged 100- and 200-period simple moving averages (SMAs), along with the recouped elevation in the 50-period SMA’s slope, are endorsing upside momentum. The bullish Ichimoku lines are reflecting a pause in positive price action, while the short-term oscillators are transmitting mixed signals in directional impetus. The MACD far above zero is dwindling towards its red trigger [..]

post-image

Technical Analysis – AUDUSD deflects off 50-MA; downside risks stay active  

Posted on July 26, 2021 at 10:12 am GMT

AUDUSD has become curbed again by the 50-period simple moving average (SMA), reviving the pair’s bearish trajectory. The price descent has endured for nearly seven-weeks now and upside sentiment appears to be lacking, something also being indicated by the dictating bearish tone in the SMAs. The Ichimoku lines are leaning slightly to the downside with the horizontal bearing of the blue Kijun-sen line; while the short-term oscillators have yet to provide convincing signals that the bulls have taken the lead. [..]

Risk Warning: Your capital is at risk. Leveraged products may not be suitable for everyone. Please consider our Risk Disclosure.