XM does not provide services to residents of the United States of America.

Technical Analysis

Technical Analysis – AUDUSD advances sharply in the FOMC aftermath

Posted on March 21, 2024 at 9:06 am GMT

AUDUSD was in a steady retreat since early March But finds feet and reclaims both SMAs after dovish FOMC Momentum indicators improve drastically AUDUSD had been losing ground since the beginning of March, dropping below its descending 50- and 200-day simple moving averages (SMAs). However, the pair managed to pause its retreat and reverse back higher with some help from the dovish FOMC signals on Wednesday. Should the advance resume, the price could initially test the March peak of 0.6666. Further upside [..]

Technical Analysis – WTI crude oil futures slip from 4-month peak

Posted on March 21, 2024 at 7:47 am GMT

WTI crude oil looks positive despite the latest drop 20- and 200-day SMAs post bullish cross MACD and RSI show positive signs WTI crude oil futures are easing after the climb towards the new four-month high of 83.11 but the broader outlook remains bullish, especially after the rally above the 80.00 round number. According to technical oscillators, the MACD is extending its positive momentum above its trigger and zero lines, while the RSI is pointing slightly up near the 70 [..]

post-image

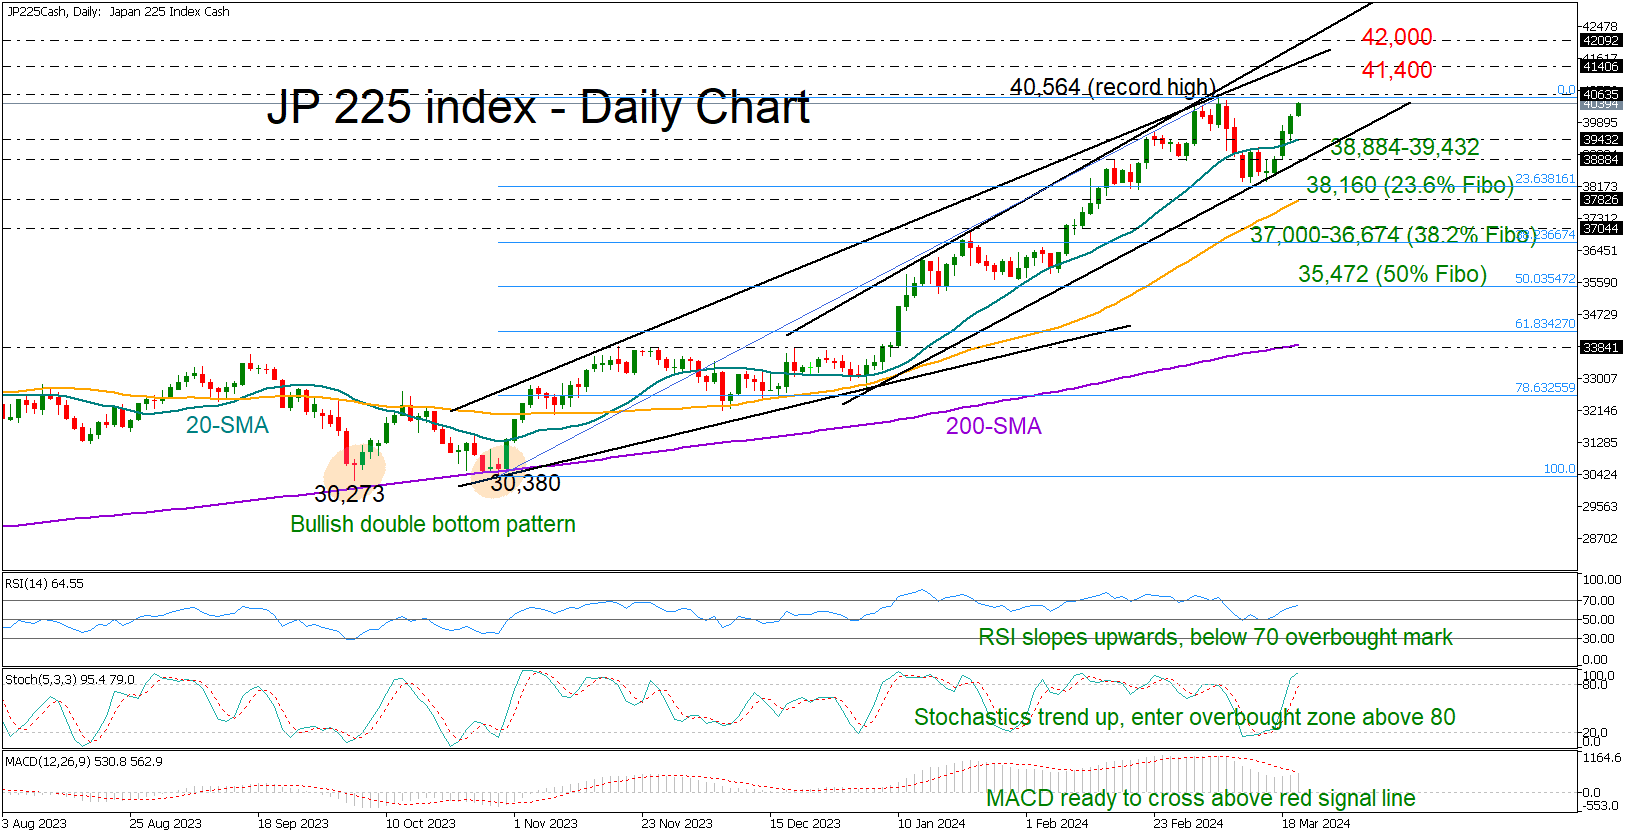
Technical Analysis – Will JP 225 index continue its record rally?

Posted on March 20, 2024 at 1:43 pm GMT

JP 225 index flirts with all-time highs Short-term technical signals remain encouraging   Japan’s 225 stock index (cash) is on the rise again, aiming to revive its five-month-old positive trend above the March record high of 40,564 after finding support near the 38,310 area. The technical signals favor the upward move in the price as the RSI is sloping northwards and is still some distance off its 70 overbought mark. The stochastic oscillator continues to trend up, and the MACD is looking [..]

post-image

Technical Analysis – Is it time for USDCAD to go for a higher high?

Posted on March 20, 2024 at 1:27 pm GMT

USDCAD rises after cooler than expected Canadian inflation A break above 1.3605 could signal uptrend continuation For the outlook to turn bearish, a dip below 1.3455 may be needed USDCAD rose yesterday after the Canadian CPI numbers came in lower than expected. However, the pair found resistance near the key barrier of 1.3605 that’s been preventing the price from moving higher since February 28, and then it pulled back. Today, the bulls retook charge, but they were stopped near the 1.3605 obstacle [..]

post-image

Technical Analysis – EURGBP struggles to surpass 23.6% Fibo

Posted on March 20, 2024 at 9:38 am GMT

EURGBP remains in sideways channel Technical oscillators lose steam EURGBP is finding another strong obstacle to surpass within the medium-term trading range of 0.8497 to 0.8578. Specifically, the 23.6% Fibonacci retracement level of the down leg from 0.8765 to 0.8497 at 0.8560. The pair is also flirting with the 20- and the 50-day simple moving averages (SMAs) and the technical oscillators are showing some weak signals. The RSI is flattening near the neutral threshold of 50, while the MACD is standing [..]

post-image

Technical Analysis – USDCHF looks to strengthen 2024 uptrend

Posted on March 20, 2024 at 8:46 am GMT

USDCHF teases 2024 resistance zone ahead of Fed policy decision Technical signals are positive for an uptrend resumption   While not making significant gains, USDCHF managed to reach a new high of 0.8897 on Tuesday, slightly surpassing its previous ceiling but still remaining around the 61.8% Fibonacci retracement of the October-December downtrend at 0.8895. The price closed just above its 200-day EMA, and the 20-day EMA is also on track to overtake it, which could make investors optimistic about the 2024 uptrend. [..]

Technical Analysis – NZDUSD in the red again ahead of the Fed

Posted on March 20, 2024 at 8:34 am GMT

NZD remains on the back foot against USD NZDUSD has finally broken below its one-year-long rectangle Momentum indicators acknowledge the current bearish move NZDUSD is recording another red candle today and it is trading below the lower boundary of the one-year-old rectangle and the busy 0.6060-0.6092 area. It has actually registered a new 2024 low with the market now turning its focus to the critical Fed meeting, which could result in increased volatility in NZDUSD as made evident by the [..]

Technical Analysis – USDJPY advances in the BoJ aftermath

Posted on March 20, 2024 at 8:21 am GMT

USDJPY storms to fresh 2024 high after BoJ’s rate hike The pair is within breathing distance from 33-year peak Momentum indicators point to overbought conditions USDJPY has been in a steady uptrend after finding its feet a tad above the 200-day simple moving average (SMA) in early March. Meanwhile, the pair posted a fresh 2024 high following a dovish hike by the BoJ on Tuesday, while it has been extending its gains ahead of the FOMC meeting later today. Should bullish pressures persist, [..]

post-image

Technical Analysis – Gold in a descending correction mode

Posted on March 20, 2024 at 7:36 am GMT

Gold creates bearish triangle after bullish rally MACD and RSI look weak Gold prices have been developing within a descending triangle in the 4-hour chart, after the rally towards the new all-time high of 2,195 on March 8. The price is posting a bearish correction with the technical oscillators indicating weak momentum. The MACD is moving horizontally beneath the zero level, while the RSI is pointing down below the 50 level. If resistance at 2,163 stands firm though, the precious metal could plummet again towards [..]

post-image

Technical Analysis – USDJPY fights for an uptrend extension

Posted on March 19, 2024 at 4:23 pm GMT

USDJPY bounces back to the 2024 resistance area Room for further improvement could be limited   USDJPY experienced heavy buying after the Bank of Japan abandoned its negative rate policy and its yield curve control program, but pledged to keep policy settings accommodative. The pair jumped vertically to an almost three-week high of 150.84, recouping the sell-off at the start of the month but still holding around the February-March ceiling. The technical indicators in the four-hour chart flag an overstretched bull [..]

Risk Warning: Your capital is at risk. Leveraged products may not be suitable for everyone. Please consider our Risk Disclosure.