XM does not provide services to residents of the United States of America.

Technical Analysis

post-image

Technical Analysis – USDJPY to hold its bullish tone

Posted on August 11, 2021 at 7:19 am GMT

USDJPY settled at solid base around the former support area of 109.05 last week, drifting northwards to claim the previous resistance area of 109.54 and peak at a one-month high of 110.73 on Wednesday. Although the neutral trajectory is still intact in the short-term picture, the momentum indicators set up the potential for another bullish swing to take place in the coming sessions, but with some caution. Specifically, the RSI is rising with a strong positive momentum above its 50 [..]

post-image

Technical Analysis – USDCHF in a strong bullish run; next target at 0.9230

Posted on August 10, 2021 at 1:02 pm GMT

USDCHF advanced by around 1.7% over the past three trading days, quickly crawling above its simple moving averages (SMAs) on the four-hour chart to top at 0.9230 today. The tough barrier from July 20 is in this neighborhood. Hence, a downside correction around 0.9230 would not be surprising, especially as the RSI and the Stochastics fluctuate above their overbought levels, warning that the recent rally could be overdone. That said, the indicators will need to show a clear shift to [..]

post-image

Technical Analysis – EURJPY maintains descending move below short-term SMAs

Posted on August 10, 2021 at 7:10 am GMT

EURJPY could not find enough buyers to overcome the 130.55 level last week, with the spotlight shifting again towards the 200-day simple moving average (SMA). Encouragingly, however, the RSI indicator is pointing up in the negative territory, providing some optimism that the bulls may not give up the battle yet. On the other hand, the stochastic oscillator is sloping downwards after the bearish cross within the %K and %D lines, overall mirroring the latest downside move from the more-than-three-year high of 134.11. The 129.80 number, where the [..]

post-image

Technical Analysis – GBPUSD slips to test 20-SMA; short-term bias neutral

Posted on August 10, 2021 at 7:08 am GMT

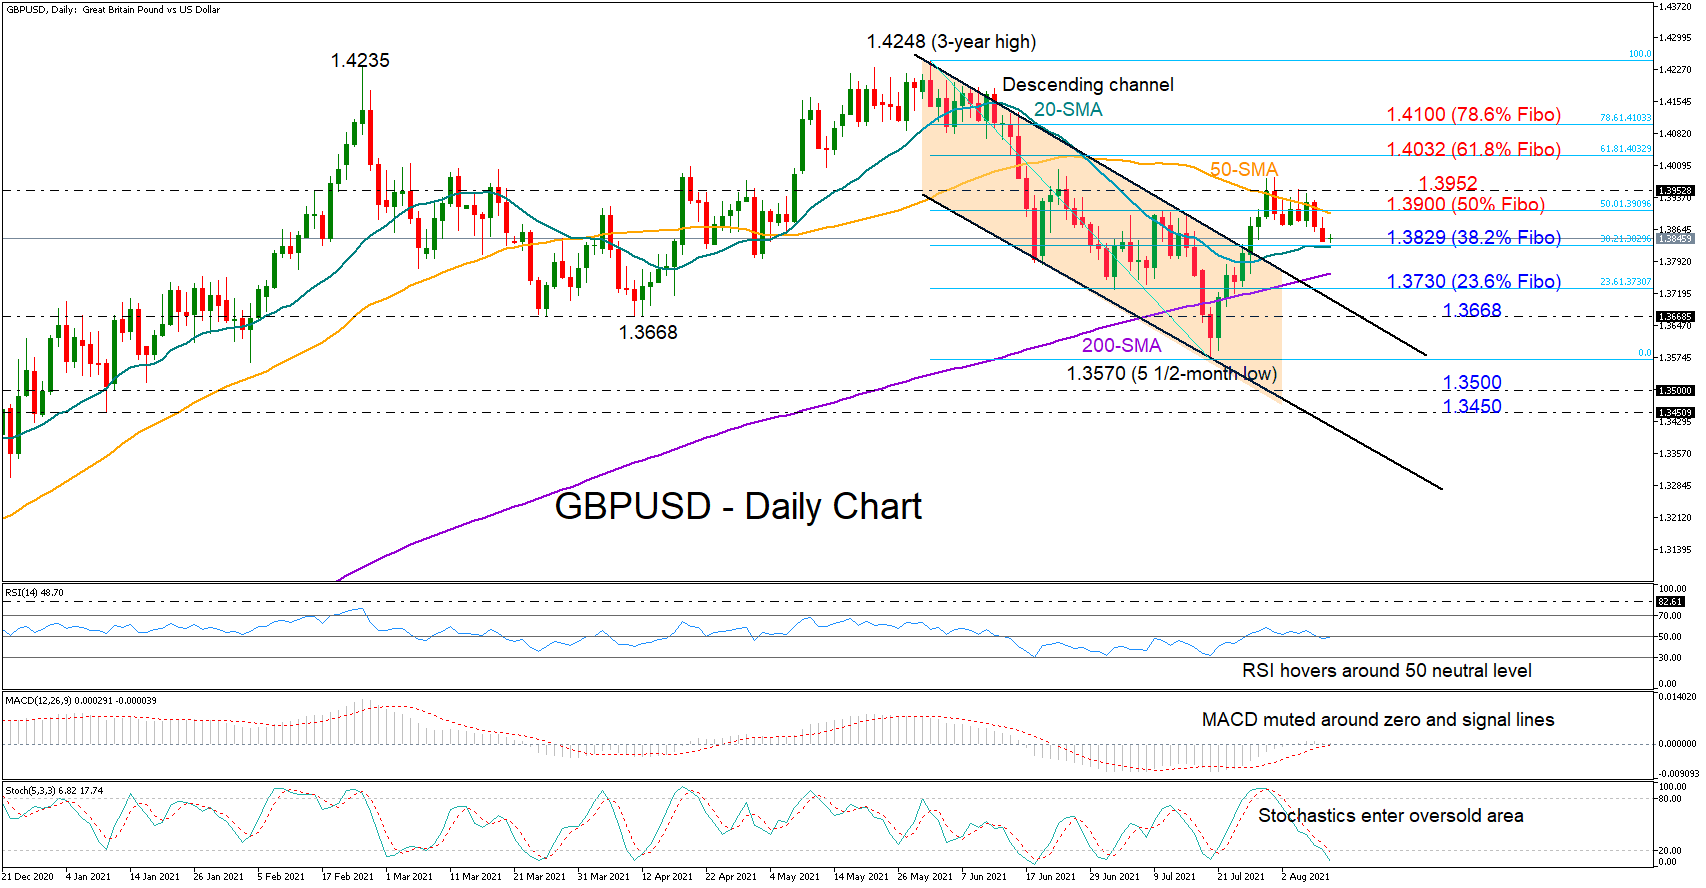
GBPUSD abandoned the intense but fruitless battle within the 1.3900 – 1.3952 resistance area to seek support near the 1.3829 level, where the 20-day simple moving average (SMA) and the 23.6% Fibonacci retracement of the 1.4248 – 1.3570 down leg overlap. Despite the pullback, the pair has not confirmed a bearish bias in the daily chart yet according to the RSI and the MACD, which continue to fluctuate around their neutral levels. Meanwhile, the Stochastics have dropped below the 20 [..]

post-image

Technical Analysis – Platinum downslide halted at 50% Fibo but upside is weak

Posted on August 9, 2021 at 2:59 pm GMT

Platinum futures steadied around 970 on Monday but remain on shaky ground with momentum indicators stuck deep in bearish territory. The price touched a 7½-month low of 951.92 earlier today, which is just below the 50% Fibonacci retracement of the long-term climb from the March 2020 low of 560.27 to the February 2021 peak of 1346.02. Although the commodity is clearly attempting a rebound, it is far from being out of the woods just yet. Both the stochastics and the [..]

post-image

Technical Analysis – AUDUSD finds support but outlook still bearish

Posted on August 9, 2021 at 1:38 pm GMT

AUDUSD gained some positive traction after steadying in the well-established 0.7335 support region following Friday’s sharp selloff. The price is currently moving higher and the stochastics are also pointing up, suggesting there could be further moderate gains in the coming sessions. However, the MACD histogram remains below zero and the red signal line continues to slope downwards. Moreover, price action is still far below the 50- and 200-period moving averages (MA) in the 4-hour chart, indicating no change to the [..]

post-image

Technical Analysis – US 500 hovers near all-time high

Posted on August 9, 2021 at 10:18 am GMT

The US 500 stock index (Cash) appears to remains upbeat, having stretched to a fresh all-time high of 4,440.04, after a recent but only minor pullback to a low of 4,229. The simple moving averages (SMAs) are maintaining firm northbound bearings, providing defences to the positive structure. However, the short-term oscillators are indicating a somewhat flat momentum on price action. The MACD, is moving horizontally above its zero level and near its trigger line, while the RSI is pointing slightly [..]

post-image

Technical Analysis – EURUSD puts some breaks on sell-off; bias still bearish

Posted on August 9, 2021 at 7:31 am GMT

EURUSD slumped in the wake of a sturdy nonfarm payrolls report on Friday, sinking back below its 20-day simple moving average (SMA) and under the 1.1800 level. Encouragingly, though, the selling pressure was not violent enough to close the session below the previous key support of 1.1760, with the price currently trying to set a foothold in the region again. However, whether the pair will successfully recoup its recent losses is an open question as the RSI is still clearly [..]

post-image

Technical Analysis – Gold plunges to new 4-month low

Posted on August 9, 2021 at 7:03 am GMT

Gold is creating a strong negative movement, reaching a fresh four-month low of 1,680 earlier today. The aggressive selling interest started from the pullback off the 20-day simple moving averages (SMA) and the RSI indicator is suggesting further losses, diving into the oversold territory, in the short-term. However, the stochastics are indicating the end of the bearish structure as it posted a bullish crossover within its %K and %D lines. If the price dips further, immediate support could come from [..]

post-image

Technical Analysis – GBPUSD consolidates around 1.3900; broader outlook bullish

Posted on August 6, 2021 at 10:05 am GMT

GBPUSD is struggling to gain positive momentum, remaining stuck within the range area with an upper boundary at 1.3957 and a lower boundary at 1.3873. The slowdown in the RSI justifies the diminishing buying pressure, while the MACD is also sending some cautious signals as it keeps hovering beneath its trigger line but above the zero level. A close above the 1.3957 barrier could raise buying interest, pushing the price towards the 1.3980 key level, which has been frequently tested at the end of July. Beyond that, [..]

Risk Warning: Your capital is at risk. Leveraged products may not be suitable for everyone. Please consider our Risk Disclosure.