XM does not provide services to residents of the United States of America.

Technical Analysis

post-image

Technical Analysis – GER 30 index claims 16,000 target for first time

Posted on August 13, 2021 at 11:13 am GMT

The German 30 index (cash) is following US indices higher but at a faster pace recently, unlocking a new record high just shy above the 16,000 psychological mark on Friday. Following the three-day-long bullish strike, a downside correction towards the previous resistance region of 15,800, which could adopt a supportive role now, could be reasonable, but the momentum indicators have yet to confirm overbought conditions. The RSI is marking new highs above a previous resistance area and has still some [..]

post-image

Technical Analysis – GBPJPY fails to overcome 153.40; neutral-to-bearish bias

Posted on August 13, 2021 at 7:58 am GMT

GBPJPY attempted to break the upper border of the neutral zone it has been ranging within this week, but its efforts proved unsuccessful as the 153.40 barrier defended the bears once again. The short-term oscillators are also in favor of the bears; the RSI is moving sideways near its 50 neutral mark and the stochastic oscillator is approaching the oversold territory after the bearish cross within the %K and %D lines. Hence, the short-run risk is looking neutral-to-negative at the [..]

post-image

Technical Analysis – USDCAD stuck in narrow range below SMAs

Posted on August 13, 2021 at 7:26 am GMT

USDCAD could barely rotate since the rejection near the 20- and 200-day simple moving averages (SMAs) on Monday, with the price edging up to close slightly above the 1.2500 level on Thursday. The momentum indicators point to a neutral-to-bearish bias as the RSI, although above its 50 neutral mark, is lacking direction, while the MACD and the Stochastics continue to slope downwards. The latest bearish deviation between the red Tenkan-sen and Kijun-sen lines is further reducing the case for a meaningful rebound. [..]

post-image

Technical Analysis – EURJPY lacks direction near SMAs

Posted on August 12, 2021 at 10:51 am GMT

EURJPY has been consolidating since July 20, failing to jump above the 23.6% Fibonacci retracement level of the down leg from 133.65 to 128.57 at 129.78 over the last few sessions. The 20- and 40-period simple moving averages (SMAs) are acting as strong support for the bulls. The RSI and the MACD are confirming the ongoing horizontal move as both are fluctuating near the neutral thresholds. In the case the price moves above the 23.6% Fibo of 129.78, it could meet immediate resistance at the 130.00 psychological level before traders’ [..]

post-image

Technical Analysis – UK 100 index pulls back from fresh highs, but key support holds

Posted on August 12, 2021 at 10:20 am GMT

The UK 100 stock index (cash) rallied above June’s highs to print a new 1 ½-year high at 7,233 on Wednesday before opening with a small negative gap slightly lower on Thursday. While the recent downfall in the RSI and the slowdown in the MACD is pressing the bias to the bearish side on the four-hour chart, the bulls may not give up the game if the red Tenkan-sen line manages once again to keep a firm footing under the [..]

post-image

Technical Analysis – AUDUSD on the sidelines for another week; trend signals negative

Posted on August 12, 2021 at 7:11 am GMT

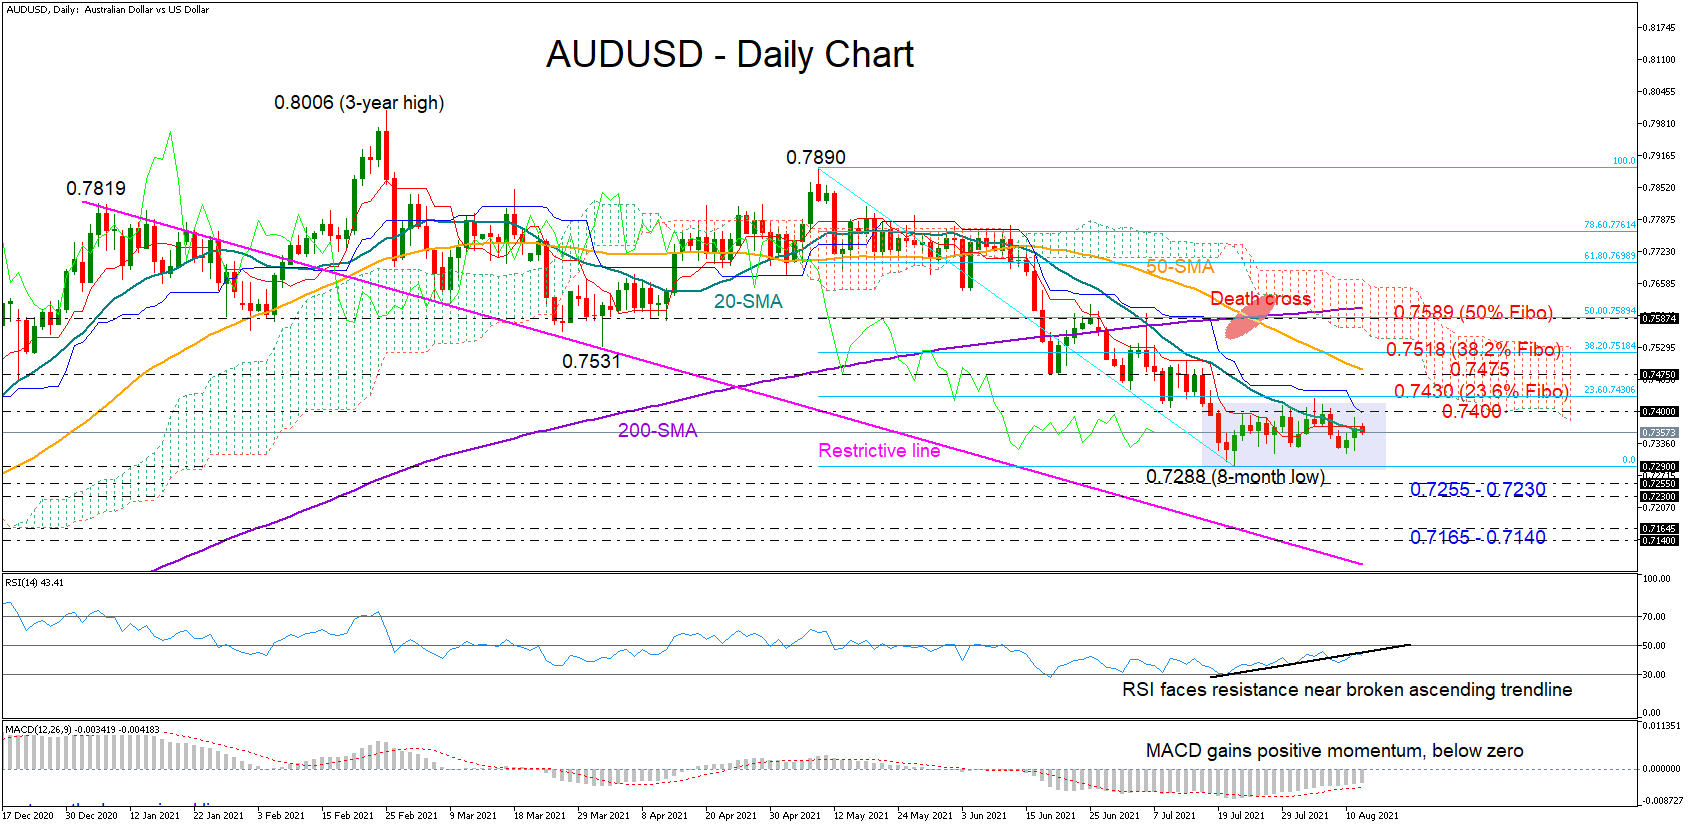
AUDUSD continues to drive sideways for the third consecutive week within the 0.7288 – 0.7430 boundaries and at the bottom of a short-term downtrend, struggling to extend any upticks above the 20-day simple moving average (SMA). The technical oscillators reflect an indecisive market as well. The RSI could not return above the broken tentative ascending trendline, questioning the bulls’ strength, whereas the MACD managed to gain more ground above its red signal line, but it has yet to enter the [..]

post-image

Technical Analysis – WTI futures slip after testing 69.00; bearish correction on cards

Posted on August 12, 2021 at 6:58 am GMT

WTI crude oil futures are struggling to gain positive momentum after their fast rebound stalled around 69.00 and within the Ichimoku cloud. The downside reversal in the RSI and the slowdown in the MACD justify the diminishing buying pressure, though both remain well below their neutral thresholds keeping the short-term risk skewed to the downside. Should selling forces strengthen, the 64.90 support level will come under the spotlight. The 60.66 barrier and the 200-day simple moving average currently at 59.85 could initially provide support [..]

post-image

Technical Analysis – EURGBP aims for a trendline breakout

Posted on August 11, 2021 at 10:18 am GMT

EURGBP closed the previous session marginally above the 20-period simple moving average (SMA) on the four-chart, but a sustainable move above the steep descending trendline, which connects the highs from July’s top of 0.8668, is required to bolster buying appetite. Although the downward slope in the SMAs keeps the odds for a trend reversal minimal, the technical oscillators are pointing to some recovery in the near term. The RSI has picked up significant pace, currently looking for a break above [..]

post-image

Technical Analysis – Gold bears lose steam, but the path ahead could be rocky

Posted on August 11, 2021 at 8:59 am GMT

Gold could barely stand on its feet following the freefall towards the 2021 lows early on Monday, which had triggered the super rally to 1,916 back in March. Despite the anaemic momentum, the precious metal seems to be building a base around 1,723 on the four-hour chart as the latest series of higher highs and higher lows in the RSI, the upside reversal in the MACD, and the positive slope in the Stochastics flag an improving sentiment. The path on the [..]

post-image

Technical Analysis – NZDUSD moves sideways near 0.7000; neutral bias

Posted on August 11, 2021 at 7:52 am GMT

NZDUSD has been moving in a horizontal trajectory over the last two months, going back and forth around its short-term simple moving averages (SMAs). In the medium-term picture, the price is developing in a descending move, trading beneath the falling trend line and the 200-day SMA. As regards the technical indicators, the RSI is flattening near its neutral threshold of 50, while the MACD has risen above its trigger line but is still near its zero level. A rally higher could meet immediate resistance at the 0.7100 psychological level, which overlaps with the 200-day SMA. The down-trending [..]

Risk Warning: Your capital is at risk. Leveraged products may not be suitable for everyone. Please consider our Risk Disclosure.