XM does not provide services to residents of the United States of America.

Technical Analysis

post-image

Technical Analysis – US 100 index slides, but uptrend still in play

Posted on August 19, 2021 at 2:15 pm GMT

The US 100 index (Cash) took some fire in recent sessions, sliding from the record high of 15,182 before encountering some support near the 50-day moving average (MA) currently at 14,720 and subsequently rebounding a little. The decline in the market has been swift, but not enough to threaten the bigger uptrend. Short-term oscillators detect negative momentum, reflecting the latest decline in the price. The RSI has dropped below 50 and is pointing lower, and while the MACD is still [..]

post-image

Technical Analysis – WTI futures plunge for the sixth straight day

Posted on August 19, 2021 at 9:19 am GMT

WTI crude oil futures plunged to a new three-month trough of 62.66 earlier today, creating the sixth straight bearish day. The MACD oscillator is falling further below its trigger and zero lines, while the RSI is touching the oversold territory. In trend indicators, the 20- and 40-day simple moving averages (SMAs) as well as the Ichimoku lines are sloping downwards. Immediate support could come from the 60.66 barrier, which overlaps with the 200-day SMA. More decreases could open the way for a longer-term [..]

post-image

Technical Analysis – AUDUSD tumbles to new 9-month low

Posted on August 19, 2021 at 7:25 am GMT

AUDUSD has reached a new nine-month low of 0.7174, which holds beneath the significant 200-week simple moving average (SMA). The negative structure in the price is confirmed by the technical indicators. The MACD oscillator decreased beneath its trigger line in the negative region, while the RSI is moving slightly lower near the oversold area. If the price dips further, this could take the market towards the next strong support at 0.6990, registered in November 2020 ahead of the 0.6775 barrier, [..]

post-image

Technical Analysis – EURJPY testing critical support; neutral outlook under threat

Posted on August 18, 2021 at 10:48 am GMT

EURJPY is testing its March low of 128.28, slipping just below it on Tuesday and earlier today. The pair has now retraced the entire upleg between March and June, and although the long-term uptrend that’s been in progress since May 2020 remains intact, the recently turned neutral picture in the medium term is at risk of switching to bearish. The latest selling phase has pushed the price below both its 50- and 200-day moving averages (MA), though more signals would [..]

post-image

Technical Analysis – USDCAD eases from 4-week high, finds support in 50% Fibo

Posted on August 18, 2021 at 8:34 am GMT

USDCAD has come off a 4-week top of 1.2648 brushed yesterday to settle around the 50% Fibonacci retracement of the late July drop, which lies at 1.2614. Technical indicators underscore the waning positive momentum. The stochastics are sliding, with the %K line approaching 50, while the MACD histogram has also started to retreat. However, the MACD not only remains comfortably in positive territory but also above its red signal line. In addition, the price is holding well above its moving [..]

post-image

Technical Analysis – USDJPY moves horizontally near 23.6% Fibonacci

Posted on August 18, 2021 at 7:45 am GMT

USDJPY is in the process of recouping the previous week’s strong losses, standing near the 23.6% Fibonacci retracement level of the up leg from 102.60 to 111.65 at 109.50. The RSI indicator is hovering in the negative region, while the MACD is stretching its bearish bias below its trigger and zero lines. In trend indicators, the 20- and 40-day simple moving averages (SMAs) are sloping downwards and the blue Kijun-sen line is travelling below the red Tenkan-sen line. More gains could lead [..]

post-image

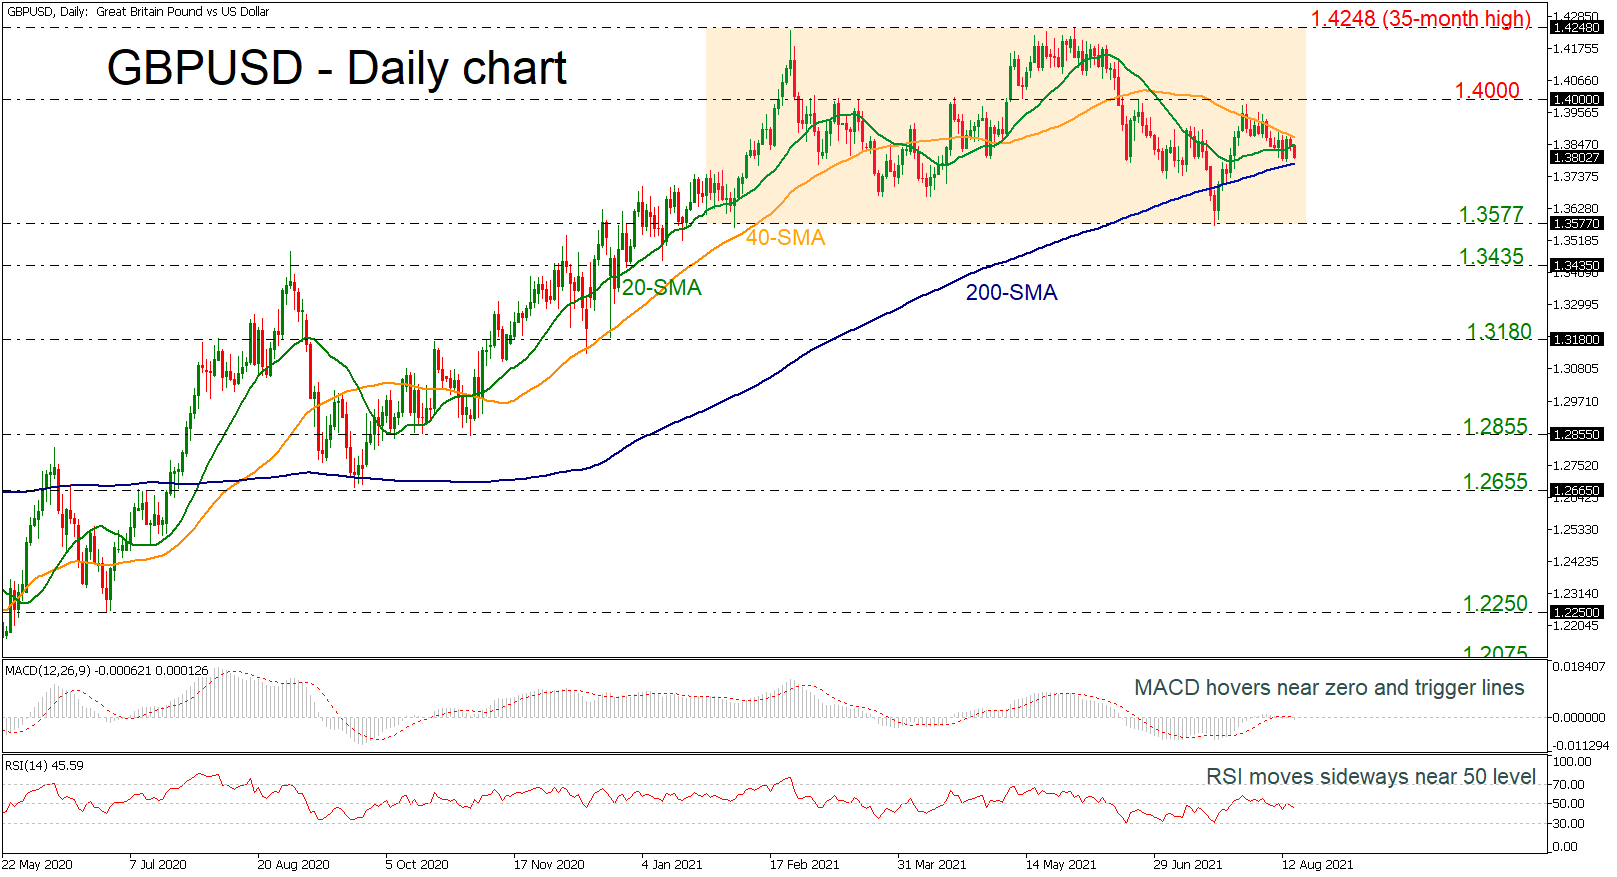
Technical Analysis – GBPUSD drifts near 1.3800 and below short-term SMAs

Posted on August 17, 2021 at 7:08 am GMT

GBPUSD is dropping below the 20- and 40-day simple moving averages (SMAs) but is still holding above the 200-day SMA and near the 1.3800 level. In the short-term, the bias looks neutral-to-bearish after the fall below the 1.4000 resistance level. Regarding the technical indicators, the MACD is flattening below its trigger and zero lines, while the RSI is moving below its neutral threshold of 50. Further losses should see the 200-day SMA currently at 1.3780 acting as a major support. [..]

post-image

Technical Analysis – Gold heads south after rebound off 4-month low

Posted on August 16, 2021 at 8:18 am GMT

Gold prices are easing after the strong bounce off the four-month low of 1,680 in the preceding week, driving the market near 1,780. The stochastic oscillator is approaching the overbought territory, while the RSI is ticking marginally down around the neutral threshold of 50. If the buying interest persists, immediate resistance could come from the 20- and 40-day simple moving averages (SMAs) at 1,790 before touching the key level of 1,800. Slightly above this hurdle, the 200-day SMA at 1,814 [..]

post-image

Technical Analysis – EURUSD flirts with 1.1800; neutral outlook

Posted on August 16, 2021 at 7:16 am GMT

EURUSD is flirting with the 20-day simple moving average (SMA) near 1.1800 after the rebound off the 1.1700 critical level, which is also the lower boundary of the seven-month consolidation area. According to the technical indicators, the RSI is rising towards the neutral threshold of 50 and the MACD oscillator is ready to cross to the upside of its trigger line in the negative region. In terms of trend indicators, the Ichimoku cloud is moving lower. However, the 20- and 40-day SMAs are [..]

post-image

Technical Analysis – JP 225 index runs out of bullish fuel near 200-SMA

Posted on August 13, 2021 at 1:27 pm GMT

Japan’s 225 stock index (cash) hit a wall just around the 200-day simple moving average (SMA) on Thursday, unable to extend its upside correction towards the tough resistance trendline, and hence making a test around the supportive trendline at 27,672 possible. A bearish bias has yet to be confirmed, as the RSI remains above its 50 neutral mark, though marginally. The Stochastics are still above their 80 overbought level despite the recent weakness, while the MACD keeps strengthening towards the [..]

Risk Warning: Your capital is at risk. Leveraged products may not be suitable for everyone. Please consider our Risk Disclosure.