XM does not provide services to residents of the United States of America.

Technical Analysis

Weekly Technical Outlook – USDJPY, EURUSD, Gold

Posted on March 26, 2024 at 1:47 pm GMT

USDJPY consolidates gains after touching important resistance EURUSD begins to recover, but threats remain Will gold’s bull run take a breather after record high?   Core PCE inflation –> USDJPY The Bank of Japan’s decision to exit negative interest rates did not provide a helping hand to the yen. Neither did the Fed’s unchanged projections of three rate cuts in 2024 weigh harshly on the US dollar, with USDJPY barely losing ground within the 151.00 territory after marking a new [..]

post-image

Technical Analysis – EURCHF rallies towards 8-month high

Posted on March 26, 2024 at 10:10 am GMT

EURCHF looks strongly bullish this year Technical oscillators confirm upside tendency EURCHF has added almost 6% since the beginning of the year, recording a new eight-month high of 0.9786. The pair is creating a steep upward tendency with no notable bearish corrections so far in 2024. The RSI indicator is standing in the overbought region and is still pointing north, while the MACD is extending its positive momentum above its trigger and zero lines. More aggressive advances could lead the pair towards the previous high [..]

post-image

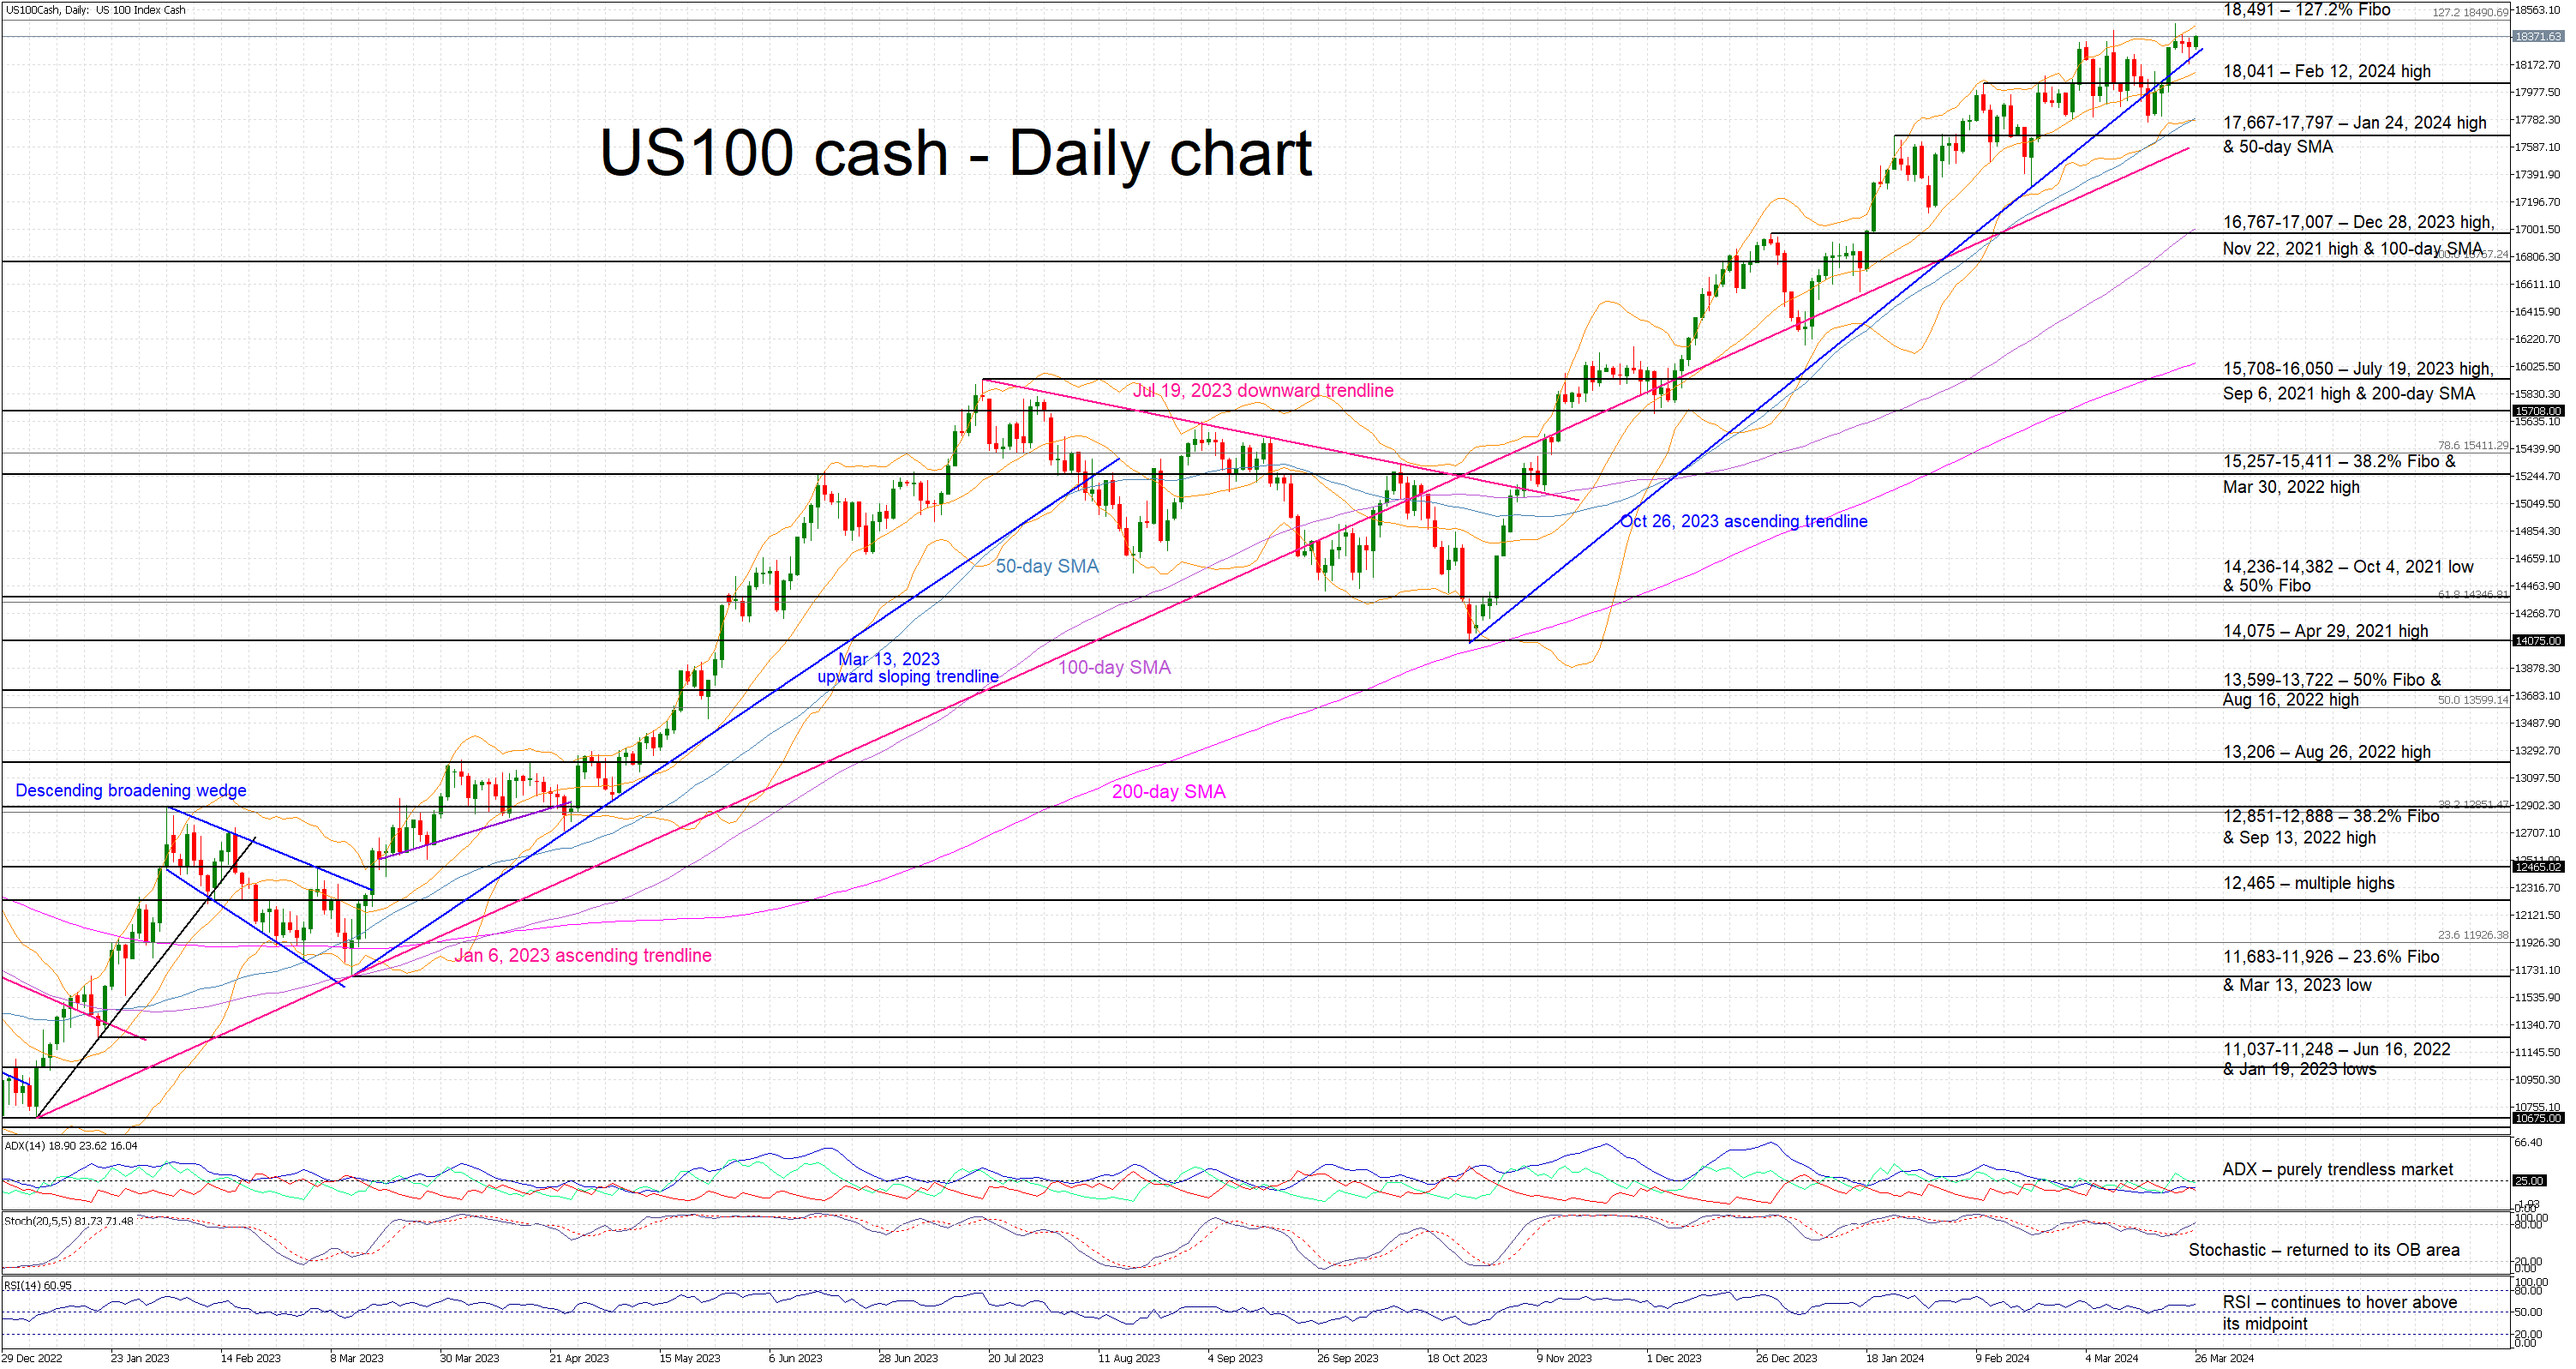
Technical Analysis – Could the quieter sessions ahead impact the US 100 index?

Posted on March 26, 2024 at 10:00 am GMT

US 100 cash index is in the green today, hovering just below its all-time high The market survived a key week and is probably preparing for the Easter break Momentum indicators remain mostly on the bulls’ side The US 100 cash index is edging higher today as the market survived, mostly unscathed, the busiest week of 2024. It continues to trade a tad below its March 21, 2024 high at 18,467 but only above the October 26, 2023 ascending trendline. Following [..]

Technical Analysis – GBPUSD bounces off 200-day SMA

Posted on March 26, 2024 at 8:19 am GMT

GBPUSD finds support at uptrend line But short-term outlook remains neutral MACD and RSI are mixed GBPUSD rebounded off the 200-day simple moving average (SMA), which coincides with the 1.2595 support level and the medium-term ascending trend line. The market has still been developing within a consolidation area since November 21, despite the break to the upside that it had on March 8, which seems to be a failed signal. Technically, the MACD oscillator is moving beneath its trigger and [..]

post-image

Technical Analysis – Gold pulls back from all-time high

Posted on March 25, 2024 at 9:46 am GMT

Gold moves horizontally within 2,145-2,195 MACD and RSI lose steam Gold prices have been moving lower over the last couple of days after the bullish spike towards the all-time high of 2,222.68 that was posted in the preceding week. The market has been developing within a narrow range of 2,145 to 2,195 since March 7 with the technical oscillators confirming a weakening bias. The MACD is holding beneath its trigger line well above the zero level, while the RSI is [..]

post-image

Technical Analysis – EURUSD dives towards 1.0800

Posted on March 25, 2024 at 7:42 am GMT

EURUSD breaks SMAs to the downside Immediate support at rising trend line MACD and RSI suggest more negative movements EURUSD is showing some strong selling interest over the last couple of days, following the pullback from the 1.0940 resistance level. The price is also falling beneath the 50- and the 200-day simple moving averages (SMAs) with the next support coming from the 1.0795 bar and the medium-term ascending trend line which may act as a turning point. Looking at the [..]

Technical Analysis – Is there stronger bullish trend for USDCAD?

Posted on March 22, 2024 at 8:54 am GMT

USDCAD switches back to gains, surpasses SMAs Technical signals cannot warrant a bullish channel breakout   USDCAD successfully recovered from a flash drop to 1.3454 and closed Thursday’s session above the 50- and 200-day SMAs, maintaining its position within the short-term bullish channel. Consequently, the bulls piled in on Friday to drive the pair above the 20-day SMA and the 50% Fibonacci retracement of the November-December downtrend, which has been a key resistance zone since the start of the year. [..]

Technical Analysis – GBPJPY plummets from 8½-year high

Posted on March 22, 2024 at 8:26 am GMT

GBPJPY may rest near 190.00 round number MACD and RSI confirm bearish retracement Broader outlook looks strongly bullish GBPJPY is retreating after the pullback off the eight-and-a-half-year high of 193.55 and is moving towards the short-term ascending trend line. According to technical oscillators, the RSI is heading south following the strong rally until the 70 level, while the MACD is losing some steam above its trigger and zero lines, both confirming the recent bearish correction. If the bears hold control, then the [..]

post-image

Technical Analysis – USDJPY reaction to the Fed and BoJ decisions

Posted on March 21, 2024 at 11:24 am GMT

Fed and BoJ decisions have some impact on USDJPY Daily chart shows some weakness for the next few sessions But weekly chart looks strongly bullish FOMC decision drives dollar lower The dollar declined following the FOMC meeting on Wednesday, as Federal Reserve Chair Powell adopted a more accommodative stance. Policymakers have maintained the dot plot’s view for this year, which indicates a total of 75 basis points worth of interest rate reductions. That was sufficient to elicit a direct response in markets following the [..]

post-image

Technical Analysis – GBPUSD trims FOMC rally amid a busy day

Posted on March 21, 2024 at 9:35 am GMT

GBPUSD corrects lower after hitting resistance at 1.2800 Technical signals weaken, but key support levels are underneath   GBPUSD rose exponentially in the aftermath of the FOMC policy meeting, but the ascending line drawn from the December 2023 low interrupted the rally near the 1.2800 level and forced a new bearish move on Thursday before the BoE policy announcement due at 12:00 GMT. On the four-hour chart, the stochastic oscillator appears to be losing momentum above its overbought level of 80, while [..]

Risk Warning: Your capital is at risk. Leveraged products may not be suitable for everyone. Please consider our Risk Disclosure.