XM does not provide services to residents of the United States of America.

Technical Analysis

post-image

Technical Analysis – Palladium futures test a bullish trend reversal scenario

Posted on September 27, 2021 at 11:33 am GMT

Palladium futures (December delivery) have been quite muted over the past couple of sessions on the four-hour chart, struggling to surpass the 20-period SMA. But despite that, there is a reason to be optimistic on the metal, as the latest downside correction to 1,914 seems to be the right shoulder of an inverse head and shoulder pattern. The bullish structure is under speculation, as a confirmation would only come above the 2,069 neckline. Also, with the RSI and the MACD hovering around their neutral [..]

post-image

Technical Analysis – USDJPY flirts with 111.00 after exciting rally

Posted on September 27, 2021 at 9:57 am GMT

USDJPY bounced rapidly on the resistance-turned-support level of 110.55 early on Monday, insisting to stretch last week’s explosive trendline breakout up to the 111.00 mark. The RSI and the Stochastics in the four-hour chart have somewhat stabilized within the overbought area, signaling that the exciting bullish action may lose steam in the near term. Hence, some speculation is growing that July’s limits within the  111.00 – 111.15 region may delay any moves towards the top of 111.65. If the bears take control, [..]

Technical Analysis – EURUSD challenges floor of 2-month trading range

Posted on September 27, 2021 at 8:37 am GMT

EURUSD remains skewed to the downside with sellers looking ready to retest the nine-and-a-half-month trough of 1.1664, which has managed to deny downward forces from snowballing. The short-term bearish tone in the pair is also being endorsed by the slight dip in the simple moving averages (SMAs). At the moment the short-term oscillators are transmitting conflicting messages in directional momentum. The MACD, not too far beneath the zero threshold, is falling below its red trigger line, while the RSI is [..]

Technical Analysis – Gold shifts northwards but lacks bullish signals

Posted on September 27, 2021 at 7:40 am GMT

Gold kicked off Monday’s session with a soft positive momentum following last week’s consolidation around 1,740 and along the dashed restrictive line, which has been occasionally acting as support to downside corrections over the past two months. Technically, there is no clear sign that the bulls will take the upper hand in the short term as the RSI is maintaining September’s downtrend below its 50 neutral mark despite the confluence with a former support region, while the MACD remains negatively [..]

post-image

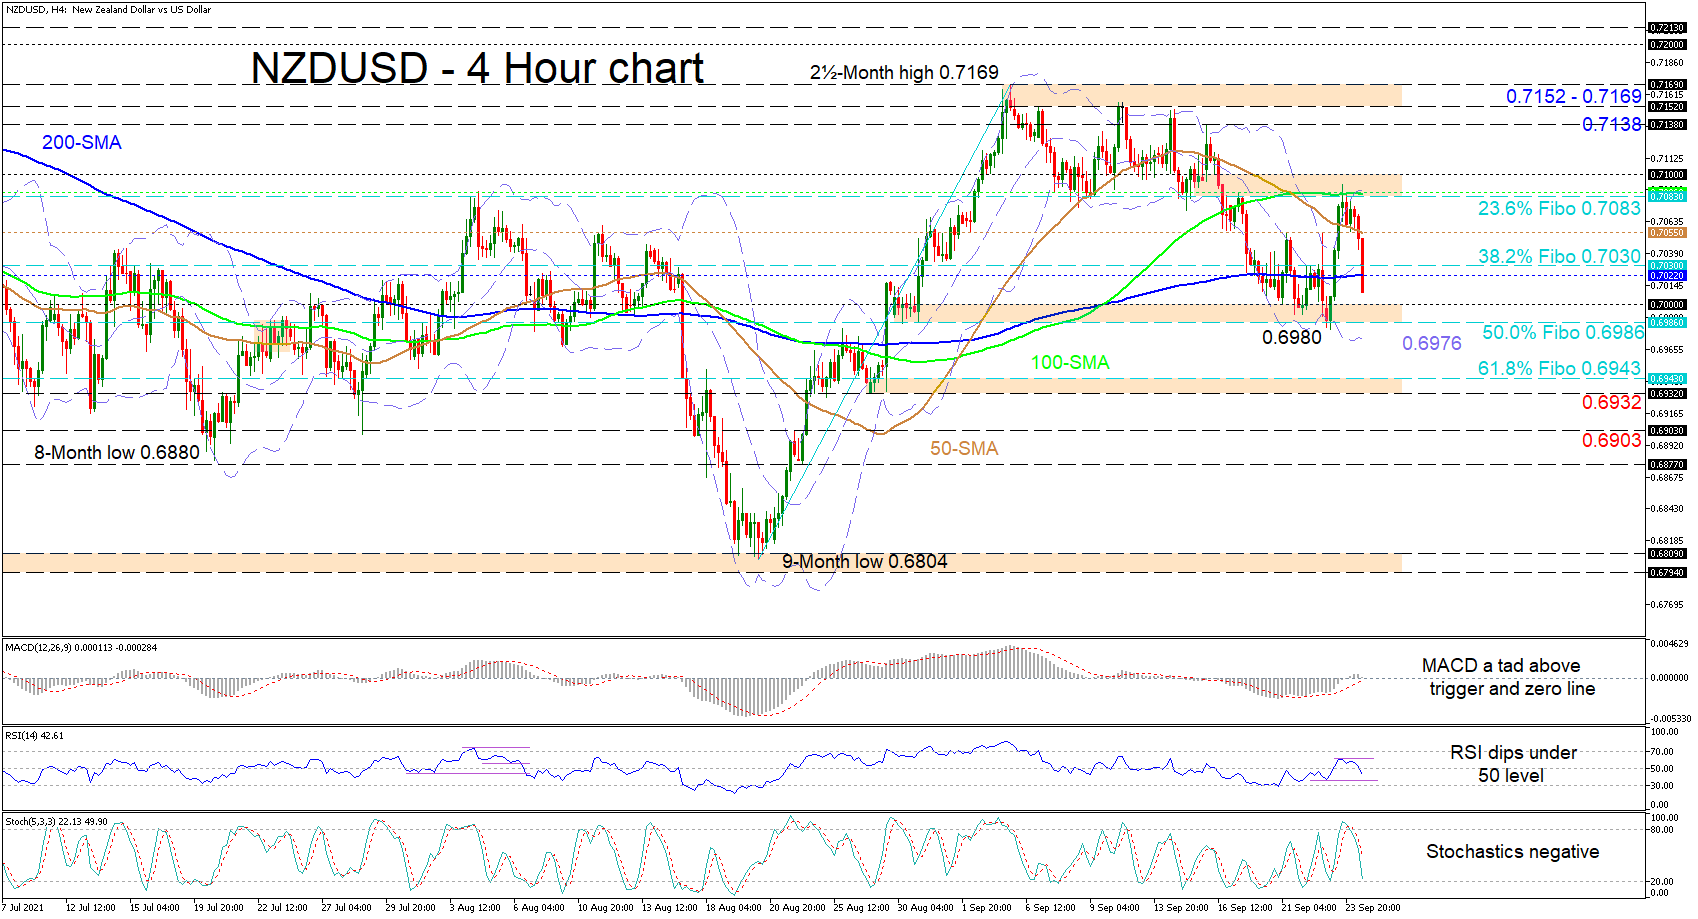
Technical Analysis – NZDUSD positive impetus fades as 100-MA deters gains

Posted on September 24, 2021 at 1:03 pm GMT

NZDUSD has dipped back down to the 200-period simple moving average (SMA) after the pair’s recent bounce around the 0.6986 level was capped by the 100-period SMA. The horizontal 100- and 200-period SMAs are promoting an overall trendless bias, while the diving 50-period SMA, is suggesting a downward tendency in the pair. At the moment the short-term oscillators are skewed more to the downside and are reflecting the pickup in bearish momentum. The MACD is holding marginally above its red [..]

post-image

Technical Analysis – US 100 index tries to gain momentum below record high

Posted on September 24, 2021 at 11:41 am GMT

The US 100 stock index (Cash) has jumped back near the 40-day simple moving averages (SMAs), which is acting as strong resistance for hitting the record high of 15,708.06 again. The short-term oscillators are favouring a descending move in the very short-term. The RSI’s fall is subsiding in the bearish region, but it is touching the 50 level, while the MACD oscillator is losing momentum below its trigger line. If buyers re-emerge and push above the SMAs, the bulls may [..]

post-image

Technical Analysis – GBPUSD support base holds firm but advances curbed by 50-MA

Posted on September 24, 2021 at 9:08 am GMT

GBPUSD’s bounce at a one-month low of 1.3608, just shy of the floor of the short-term trading range, has become capped by the 50-period simple moving average (SMA). The trendless SMAs have been zig zagging for around two-months and are now holding a slight bearish tilt, with the 50-period SMA exhibiting a more potent negative bearing. The Ichimoku lines are indicating that downward forces have yet to fully abate, while the short-term oscillators are conveying conflicting messages in directional momentum. [..]

Technical Analysis – USDCAD loses battle with key resistance; uptrend stagnates

Posted on September 24, 2021 at 7:39 am GMT

USDCAD saw its bullish efforts evaporate near the tough resistance of 1.2824 for the second time at the start of the week despite the peak at 1.2895, with the price aggressively slumping to 1.2832 in the aftermath. The short-term risk is currently viewed as neutral as the RSI has paused its downfall around 50, while the MACD has pulled lower within the positive area to test its red signal line. As regards the market trend, the bullish intersections between the [..]

Technical Analysis – GBPJPY surpasses 200-day SMA in descending channel

Posted on September 24, 2021 at 7:05 am GMT

GBPJPY is advancing above the 200-day simple moving averages (SMAs) and the 23.6% Fibonacci retracement level of the up leg from 129.30 to 156.06 t 149.75, remaining in a medium-term downward sloping channel. Regarding the technical indicators, the stochastic oscillator is turning upwards after the bullish crossover within the %K and %D lines in the oversold territory, suggesting a positive bias. Moreover, the RSI is rising in the positive region, following the rebound off the 30 level. A break above [..]

post-image

Technical Analysis – EURJPY forms inverse head and shoulders; advances curbed by 200-MA

Posted on September 23, 2021 at 3:51 pm GMT

EURJPY is currently pushing up against the 200-period simple moving average (SMA) after completing what looks to be an inverse head and shoulders reversal pattern. The SMAs are still promoting a deteriorating trend in the pair but the Ichimoku lines are indicating upward forces have improved. The short-term oscillators are also reflecting the increase in positive momentum. The MACD is soaring above its red trigger line and is nearing the zero mark, while the RSI is making gains in the [..]

Risk Warning: Your capital is at risk. Leveraged products may not be suitable for everyone. Please consider our Risk Disclosure.