XM does not provide services to residents of the United States of America.

Technical Analysis

post-image

Technical Analysis – WTI futures touch 7-year high levels around 84-dollar handle

Posted on October 21, 2021 at 3:37 pm GMT

WTI oil futures have climbed to a 7-year high after the price creeped above the simple moving averages (SMAs) and broke above the previous high of 76.20. The bullish SMAs are feeding the one-month rally that began around the 61.77 level, just above the 200-day SMA. Sellers have resurfaced and have pushed the price back down from the 84.05 high meeting support around the red Tenkan-sen line at 81.30. The rising Ichimoku lines are indicating that positive forces are trying [..]

post-image

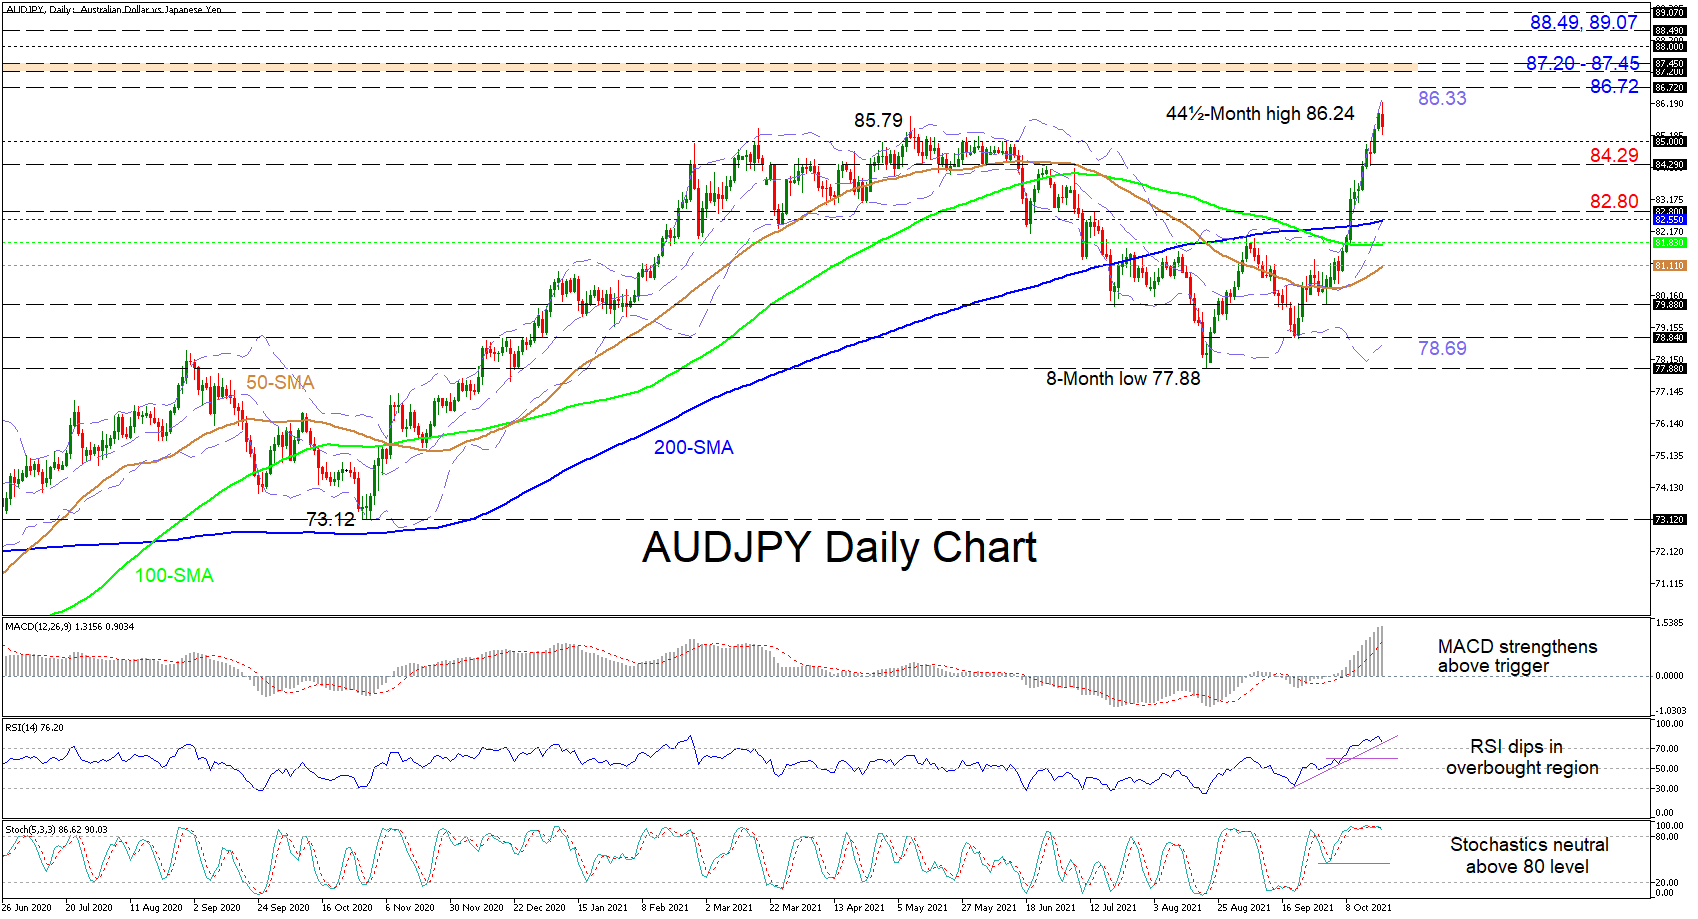
Technical Analysis – AUDJPY rockets to 44½-month high before negative forces surface

Posted on October 21, 2021 at 1:30 pm GMT

AUDJPY has been tracing the upper Bollinger band for two weeks now, reaching a more than 3½-year high of 86.24, as the pair aims for the 86.72 barrier. The price rally, which extended above the simple moving averages (SMAs) and the 82.00 handle, accelerated from the 79.88 level until the fresh high, before sellers made an appearance. The recent uptrend is not subsiding despite opposing forces, something also being demonstrated in the abated negative bearing of the 100-day SMA and [..]

post-image

Technical Analysis – EURJPY eases below 133.00 but the broader picture is bullish

Posted on October 21, 2021 at 10:07 am GMT

EURJPY recorded its second 4-hour session of losses after a failed attempt to break significantly above the four-month high of 133.45. Chances for a reversal are increasing as the 20-day simple moving average is turning lower after two weeks, suggesting that the next move in the price is more likely to be down. The MACD continues to fall below its red signal line, supporting the bearish view as well. Another step lower may reach a key support at the 40-period SMA at 132.36. Should [..]

Technical Analysis – AUDUSD’s bullish improvement under question

Posted on October 21, 2021 at 8:44 am GMT

AUDUSD’s three-week upside momentum seems to be fading ahead of the 200-day simple moving average (SMA). The negative bearing of the 50- and 100-day SMAs has softened, while the 200-day SMA is hovering. Overall, the SMAs are not demonstrating a definitive price trend, signalling a more neutral price trajectory. The climbing Ichimoku lines have yet to confirm a dampening in bullish forces, while the short-term oscillators’ conflicting signals are hinting some easing in positive momentum. The MACD is some distance [..]

Technical Analysis – GBPAUD steps on key trendline after five bearish weeks

Posted on October 21, 2021 at 7:58 am GMT

GBPAUD is in the fifth week of declines but hopes for a bullish transition are currently growing large as the price is challenging the key ascending trendline drawn from January’s lows and the 200-day simple moving average (SMA) at 1.8323. Although the bearish intersection between the 20- and 50-day SMAs keeps promoting the negative trajectory in the short-term picture, the pair seems to have already met oversold conditions according to the momentum indicators; the RSI is charting a higher low [..]

post-image

Technical Analysis – EURUSD struggles to expand beyond 1.1670

Posted on October 21, 2021 at 7:23 am GMT

EURUSD is moving slightly lower following the pullback off the 38.2% Fibonacci retracement level of the downward move from 1.1908 to 1.1523 at 1.1670 again. Technically, the RSI indicator is showing some weakening signals as it is pointing south in the negative region and the MACD is sloping down beneath its trigger line but is still above the zero level. However, the 20- and 40-period simple moving averages (SMAs) are heading up following the bullish wave on price that started [..]

post-image

Technical Analysis – Tesla stock bullish but overbought ahead of Q3 earnings

Posted on October 20, 2021 at 3:46 pm GMT

Tesla’s stock rose exponentially last week to finally close the large gap with January’s record high of 899.98, but as the clock is ticking down to the Q3 earnings release today, traders are wondering whether the price can sail back to uncharted waters or start a new bearish cycle. From a technical perspective, the latest upswing is looking overstretched. The RSI and the Stochastics seem to lose steam above their overbought levels, while the price’s close above the Bollinger band [..]

post-image

Technical Analysis – EURCHF’s upside looks bleak as sellers lead

Posted on October 20, 2021 at 3:21 pm GMT

EURCHF has plunged back below the simple moving averages (SMAs) after the positive price action was halted around the 1.0763-1.0771 resistance band. The bearish bearing of the SMAs is backing the pair’s negative trajectory. The short-term oscillators are also signalling that downside pressures are growing. The MACD, in the positive section, is dipping and has neared the red trigger line, while the RSI is diving in bearish territory. The strong negative charge in the stochastic oscillator is endorsing the control [..]

post-image

Technical Analysis – EURGBP finds foothold around 19½-month lows

Posted on October 20, 2021 at 1:29 pm GMT

EURGBP is currently pushing above the mid-Bollinger band at 0.8442, following a two-and-a-half-week decline that found its feet around the 0.8418 mark. The falling simple moving averages (SMAs) are endorsing the active downtrend despite buyers trying to make a comeback. The short-term oscillators are reflecting the recent pickup in positive forces. The MACD, in the negative region, is above its red trigger line, while the RSI is making efforts to break above the 50 threshold. The stochastic oscillator’s positive charge [..]

Technical Analysis – USDJPY advances stumble at near 4-year highs

Posted on October 20, 2021 at 8:43 am GMT

USDJPY’s one-month rally off 109.19 may be running out of steam in the vicinity of the resistance band of 114.54-114.73, formed between the October 2018 and November 2017 rally peaks. Nonetheless, the climbing simple moving averages (SMAs) are endorsing the bullish picture. The Ichimoku lines are indicating that positive momentum is growing, while the short-term oscillators are still leaning towards the upside. The MACD, deep in the positive region, is persisting above its red trigger line, while the RSI, which [..]

Risk Warning: Your capital is at risk. Leveraged products may not be suitable for everyone. Please consider our Risk Disclosure.