XM does not provide services to residents of the United States of America.

Technical Analysis

post-image

Technical Analysis – EURJPY points to more losses ahead of ECB policy meeting

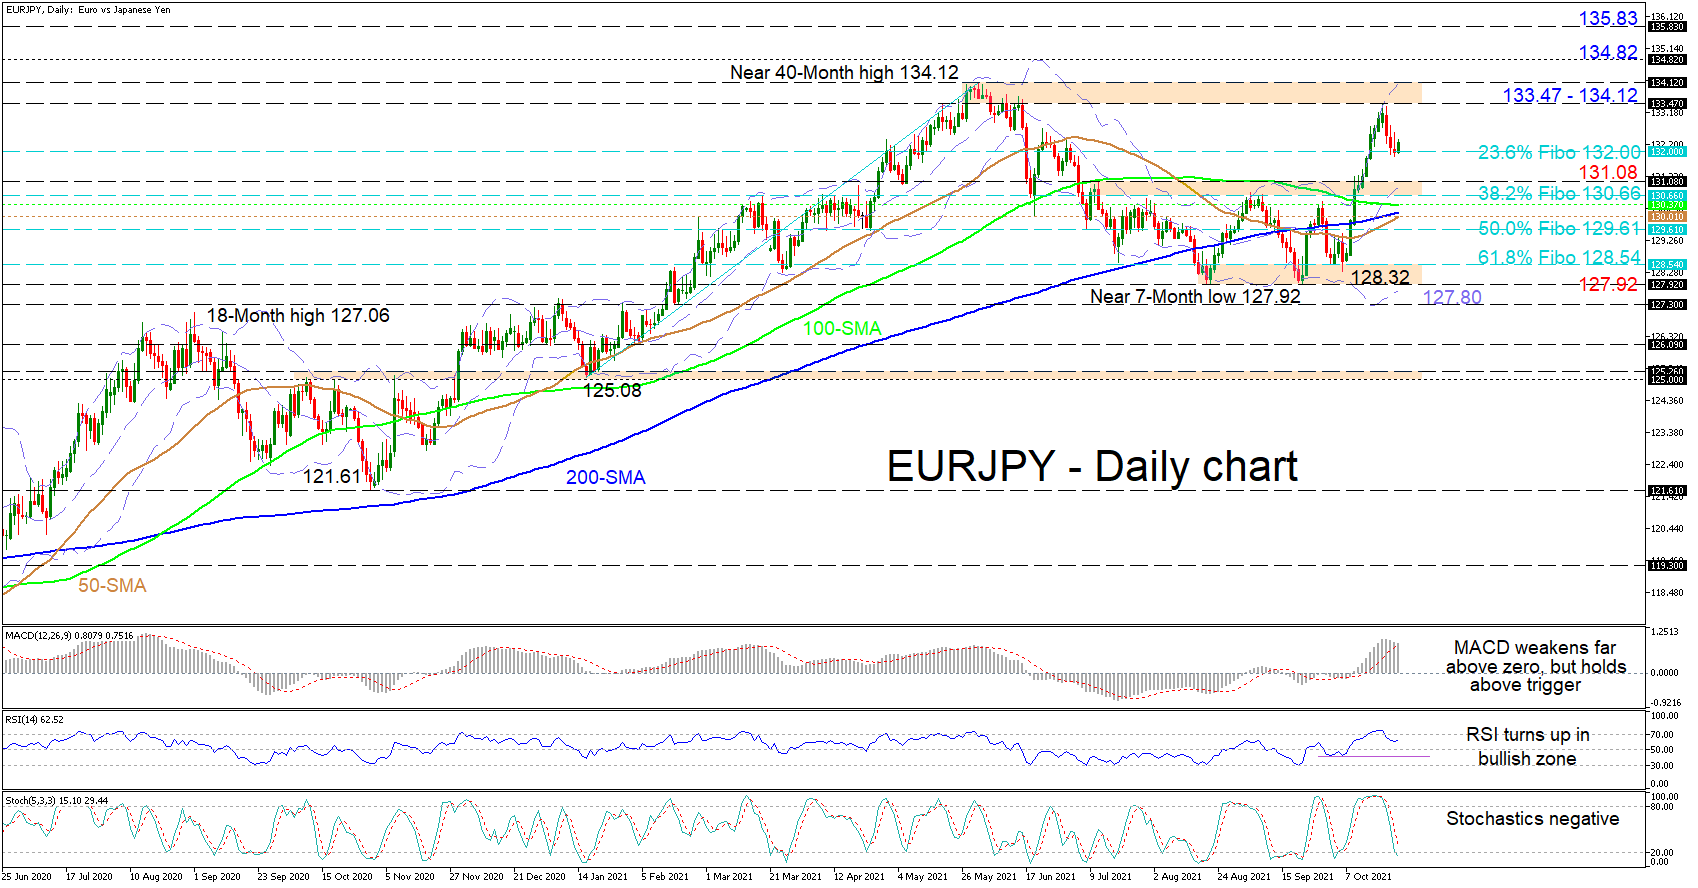
Posted on October 28, 2021 at 9:25 am GMT

EURJPY entered a downhill race following the peak at a four-month high of 133.47 in the four-hour chart, correcting below its shorter-term simple moving averages (SMA) and more recently below the Ichimoku cloud, which kept the bears under control on Wednesday. The downturn in the RSI and the MACD is gaining fresh momentum in the bearish territory as the Stochastics are drifting lower again despite their latest bounce off the oversold area, all flagging additional losses ahead for the market. [..]

post-image

Technical Analysis – AUDUSD stuck around 0.7500, but bias still positive

Posted on October 28, 2021 at 7:37 am GMT

AUDUSD keeps fighting for a decisive close above the 0.7500 level for the second consecutive week, despite setting a foothold near the 0.7460 number. The recent fruitless bullish attempts suggest buying forces are fizzling out, with the MACD and the RSI somewhat endorsing that view as the former is rising at a relatively softer pace and the latter seems to be creating a lower high below its 70 overbought mark. Yet, as long as the indicators remain within the bullish [..]

post-image

Technical Analysis – GBPJPY sellers struggle to amplify price pullback   

Posted on October 27, 2021 at 1:58 pm GMT

GBPJPY is currently finding its feet around a support barrier shaped between the 156.00 handle and the highs reached in late May and early June. Even though the 100- and 200-period simple moving averages (SMAs) are defending the positive structure, the price dip beneath the 50-period SMA is implying some waning in the positive drive. Currently, the Ichimoku lines are not displaying a clear price direction, while the short-term oscillators are conveying conflicting signals in momentum. The MACD is slightly [..]

post-image

Technical Analysis – Boeing’s stock nears key support ahead of Q3 earnings

Posted on October 27, 2021 at 10:32 am GMT

Boeing’s stock price has been on the sidelines since the peak to a one-year high of 278.28 in March, remaining trapped below the strong ascending trendline for another month and far below its pre-pandemic levels. The American aircraft designer will publish its Q3 earnings results today before the market open, but the technical picture is currently providing little hope for any significant progress. The MACD seems to have started a new bearish cycle in the negative area, while the RSI [..]

Technical Analysis – NZDUSD gains at risk as sellers push back

Posted on October 27, 2021 at 8:50 am GMT

NZDUSD buyers have re-emerged after the minor price retreat but attempts to limit sellers’ ruling power are looking to have been in vain. As of late, the trendless simple moving averages (SMAs) are proposing a more neutral bearing in the pair. The Ichimoku lines are reflecting the fresh rally and are indicating a pause in positive momentum, while the short-term oscillators are transmitting conflicting messages of directional impetus. The MACD, north of the zero threshold, is keeping above its red [..]

post-image

Technical Analysis – EURAUD drops to 7-month low; bearish drive loses power

Posted on October 27, 2021 at 8:35 am GMT

EURAUD is pushing hard to hold above May’s support of 1.5418 after a flash drop to a seven-month low of 1.5396 earlier in the day. The pair has been making lows after lows during the past six weeks, therefore an upside reversal may not take long to form. That said, the RSI has yet to show a convincing rotation despite its consolidation around its 30 oversold level, the Stochastics are decelerating again following the bounce off the 20 oversold mark, [..]

Technical Analysis – USDJPY takes a breather before rallying again

Posted on October 27, 2021 at 7:04 am GMT

USDJPY has rebounded off the 113.40 support level with the simple moving averages (SMAs) following the market action. However, the MACD oscillator is diving below its trigger line in the positive region, while the RSI is sloping down around the 70 level. Both are suggesting that the next move may be to the downside rather to the upside. If the pair slips below the 113.40 barrier, it could take the market towards the 20-day SMA at 113.00 ahead of the [..]

post-image

Technical Analysis – Amazon stock eases near 200-day SMA prior to earnings announcement

Posted on October 26, 2021 at 12:37 pm GMT

Amazon stock has been trending downwards in the medium term after achieving an all-time high of 3,769 in early July, but since August, it has adopted a more sideways pattern. The short-term picture for the stock seems neutral, as its price moves without a clear direction. However, in the last few sessions, a bearish bias has emerged with momentum indicators further reinforcing this view. The stochastic oscillator is declining after posting a bearish cross in the overbought area, while the RSI is [..]

post-image

Technical Analysis – Apple stock regains positive momentum

Posted on October 26, 2021 at 12:32 pm GMT

Apple’s stock has regained its positive momentum after its early October lows, surpassing its 50-day simple moving average (SMA) and targeting its all-time high at 157.12. Short-term oscillators are supporting a positive bias, as the RSI is hovering steadily above its 50 neutral mark, while the MACD is found above zero and its red signal line, reflecting the recent appreciation of the stock price. Should the price continue its uptrend movement, buyers may target the 150.00 region. Surpassing this barrier [..]

post-image

Technical Analysis – EURJPY buyers resurface at 23.6% Fibonacci at 132

Posted on October 26, 2021 at 8:11 am GMT

EURJPY’s minor pullback is finding its feet at the 132.00 handle, that being the 23.6% Fibonacci retracement of the up leg from 125.08 until 134.12, after its latest rally that began at 128.32 lost steam just shy of the 133.47-134.12 resistance zone. A definitive trend is not being endorsed by the 50- and 100-day simple moving averages (SMAs), which are converging with the 200-day SMA. The short-term oscillators are conveying mixed signals in directional impetus. The MACD and the stochastic [..]

Risk Warning: Your capital is at risk. Leveraged products may not be suitable for everyone. Please consider our Risk Disclosure.