XM does not provide services to residents of the United States of America.

Technical Analysis

Technical Analysis – EURJPY selloff could have more legs; neutral in medium-term

Posted on November 10, 2021 at 1:34 pm GMT

EURJPY has erased half of October’s rally, which peaked at a four-month high of 133.47, with the 50- and 200-day simple moving averages (SMAs) recently coming into the rescue to impede the sell-off around 130.50. The technical status, however, is still bearish. The RSI has stretched its downtrend into bearish territory, while the MACD continues to lose ground below its red signal line as the Stochastics head back into the oversold zone. Hence, unless the longer-term SMAs build a solid [..]

post-image

Technical Analysis – EURNZD negative bias fades amid an overall bearish outlook

Posted on November 10, 2021 at 11:45 am GMT

EURNZD negative bias appears to be fading as the pair bounced back from its 1.6079 low at the beginning of the month. However, the overall bearish outlook is still maintained as the price is well below its 50- and 200-day simple moving average (SMA). The waning negative momentum is also supported by the short-term momentum indicators, as the RSI is increasing but remains below its 50 neutral mark, while the MACD is found below zero and above its red signal [..]

post-image

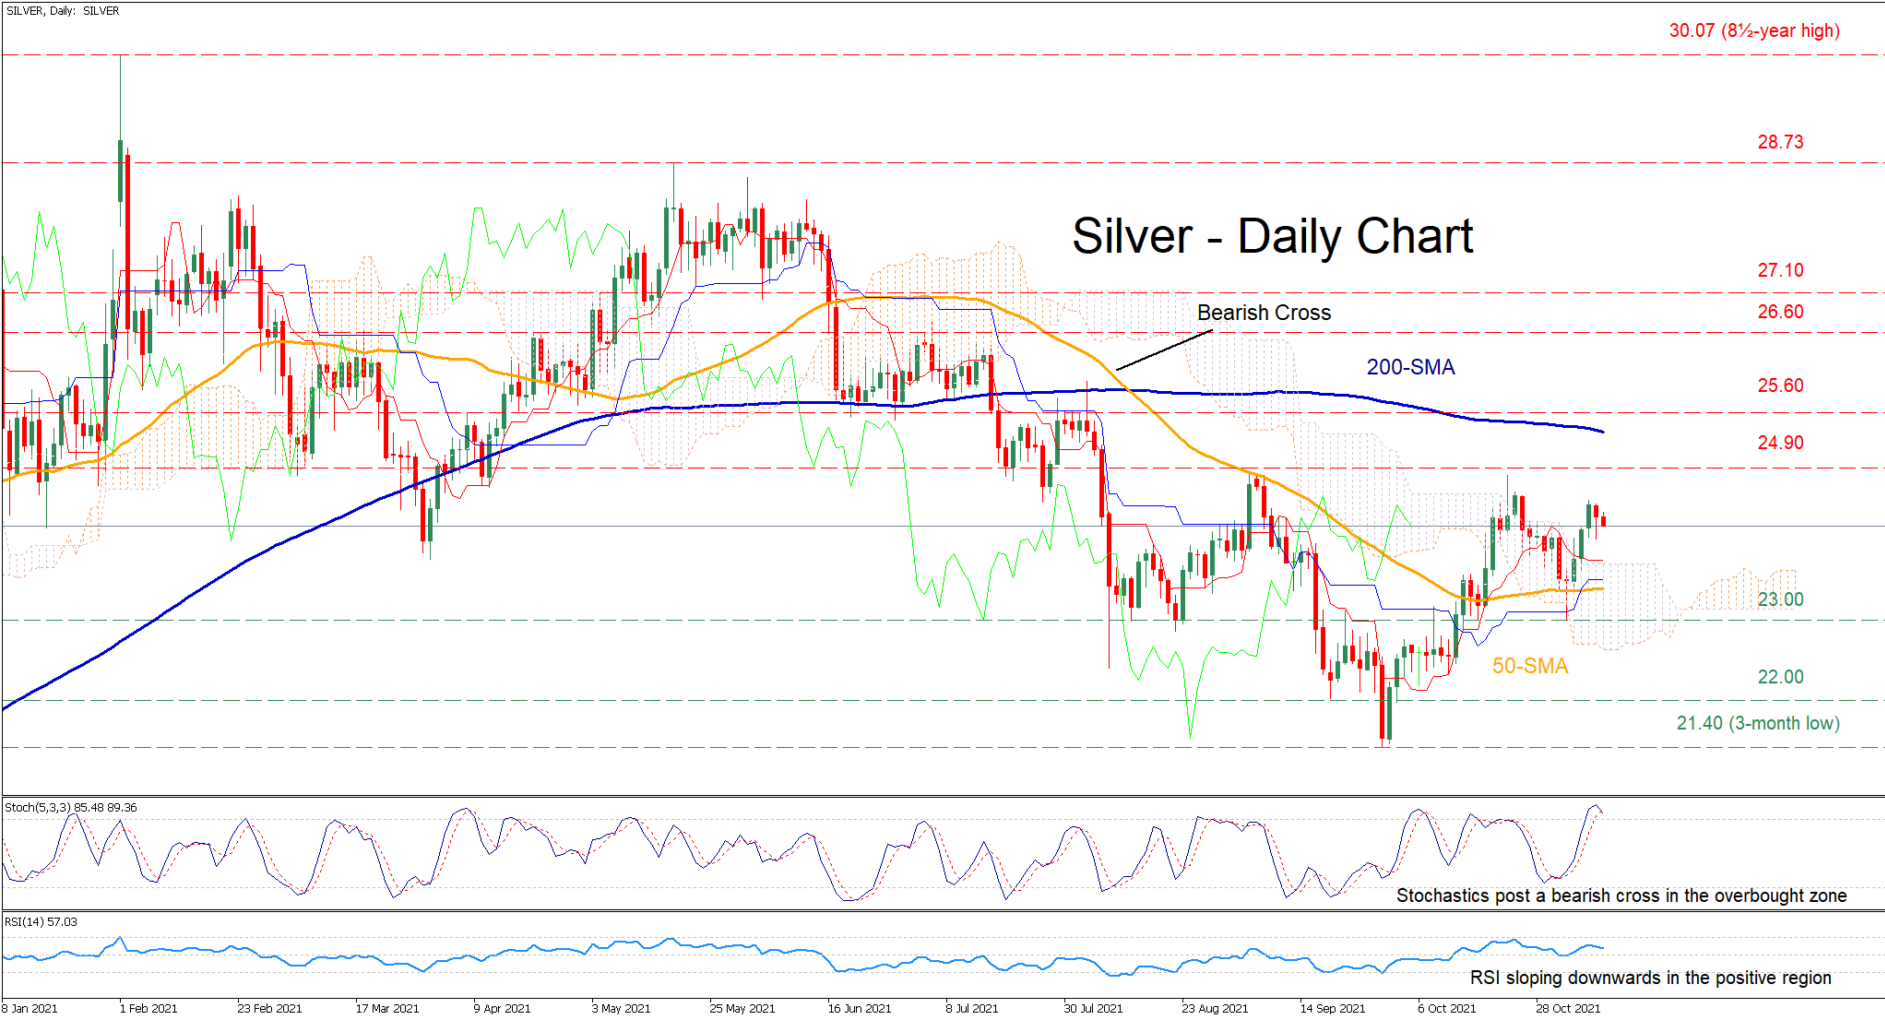
Technical Analysis – Silver’s rebound in question as positive momentum fades

Posted on November 10, 2021 at 11:44 am GMT

Although silver has been giving up ground since early May, the precious metal has recently demonstrated promising signs for a rebound. Following a bullish cross above its 50-day simple moving average (SMA), the price is currently trading above the Ichimoku cloud. However, the recovery might come short as the immediate bias is turning bearish. The short-term oscillators further reinforce the loss of momentum for the metal. The RSI is pointing down in the positive region, while the stochastics have posted [..]

post-image

Technical Analysis – GBPJPY consolidates around 153.00 in short-term

Posted on November 10, 2021 at 10:11 am GMT

GBPJPY has been moving sideways within the 153.65-152.80 zone over the last week. The 20- and 40-period SMAs are below the 200-period SMA, indicating more losses ahead. Even so, the MACD oscillator is rising above its trigger line in the negative zone, while the RSI is falling. Any falls below the 152.55-115.80 support zone could trigger a stronger bearish movement towards the 150.67 support and 149.20-148.93 support zones. On the other hand, if the market breaks through the 153.65 resistance level, it [..]

post-image

Technical Analysis – NZDUSD crossed below the red Ichimoku cloud; negative bias arises

Posted on November 10, 2021 at 10:09 am GMT

NZDUSD has lost its positive momentum after failing to break above its 0.7176 level in the past couple of sessions. The pair has currently crossed below the red Ichimoku cloud and its 50-day simple moving average (SMA), promoting a negative short-term outlook. The negative bias and the recent price depreciation of the pair are also supported by the short-term momentum indicators, as the RSI is hovering below its 50 neutral mark, while the MACD is found below zero and its [..]

post-image

Technical Analysis – AUDUSD crosses below its 200-SMA; bearish bias arises

Posted on November 10, 2021 at 9:42 am GMT

AUDUSD has been trending upwards over the past month after it managed to get strong support at the September low of 0.7169. However, the short-term picture has started to deteriorate as the pair’s rally halted at the 3-month high of 0.7554. Since then, the price has been dipping down, crossing below both its 50- and 200-period simple moving averages (SMAs). The negative short-term trend is likely to strengthen, as the momentum indicators suggest an imminent bearish bias. Specifically, the stochastic [..]

Technical Analysis – USDJPY’s bullish structure at risk as price drops to 113 area

Posted on November 10, 2021 at 9:41 am GMT

USDJPY’s recent retracement from a near 4-year high of 114.73 has snagged in the vicinity of the 113.00 handle and the blue Kijun-sen line, but upside forces remain vulnerable. The lagging simple moving averages (SMAs) are climbing and continue to back advances in the pair despite growing negative pressures – reflected by the pullback in the price. The Ichimoku lines are indicating some waning in the positive drive but have yet to confirm negative pressures as the frontrunner. Currently, the [..]

post-image

Technical Analysis – EURUSD flirts with 40-SMA after the decline from 200-SMA

Posted on November 10, 2021 at 8:22 am GMT

EURUSD has found strong resistance at the 200-period simple moving average (SMA) around 1.1600, holding beneath the Ichimoku cloud and above the short-term SMAs. However, the RSI is ticking marginally up in the positive region, while the MACD is standing above its zero line, suggesting that the rebound off the 16-month low of 1.1513 is still in place. A successful climb above the 200-period SMA could take the market towards the 1.1615 resistance. Even higher, the top of 1.1690 may [..]

post-image

Technical Analysis – Gold stumbles around 2-month high levels

Posted on November 9, 2021 at 4:15 pm GMT

Gold seems to be struggling to overcome the resistance ceiling of 1,827-1,834 that has held since mid-July, following the recent climb from the 1,759 level. The bullish simple moving averages (SMAs) are sponsoring the recent ascent in the price. That said, the short-term oscillators are contradicting the lagging averages, indicating that positive forces are fading. The MACD, deep in the positive region, has flattened and neared its red trigger line and is looking to dip below it. The RSI and [..]

post-image

Technical Analysis – USDCHF crossed below its 50- and 200-day SMA; bearish outlook

Posted on November 9, 2021 at 12:18 pm GMT

USDCHF regained its negative momentum as the pair crossed below its 50- and 200-day simple moving average (SMA) in the past couple of sessions. This diminished hopes of a sustained bullish move after a brief period of price appreciation when the 50-day SMA had crossed above its 200-day SMA. The bearish outlook and the recent price depreciation are also supported by the short-term momentum indicators, as the RSI is hovering below 50, while the MACD has dropped below zero and [..]

Risk Warning: Your capital is at risk. Leveraged products may not be suitable for everyone. Please consider our Risk Disclosure.