XM does not provide services to residents of the United States of America.

Technical Analysis

post-image

Technical Analysis – Silver exits long-term range
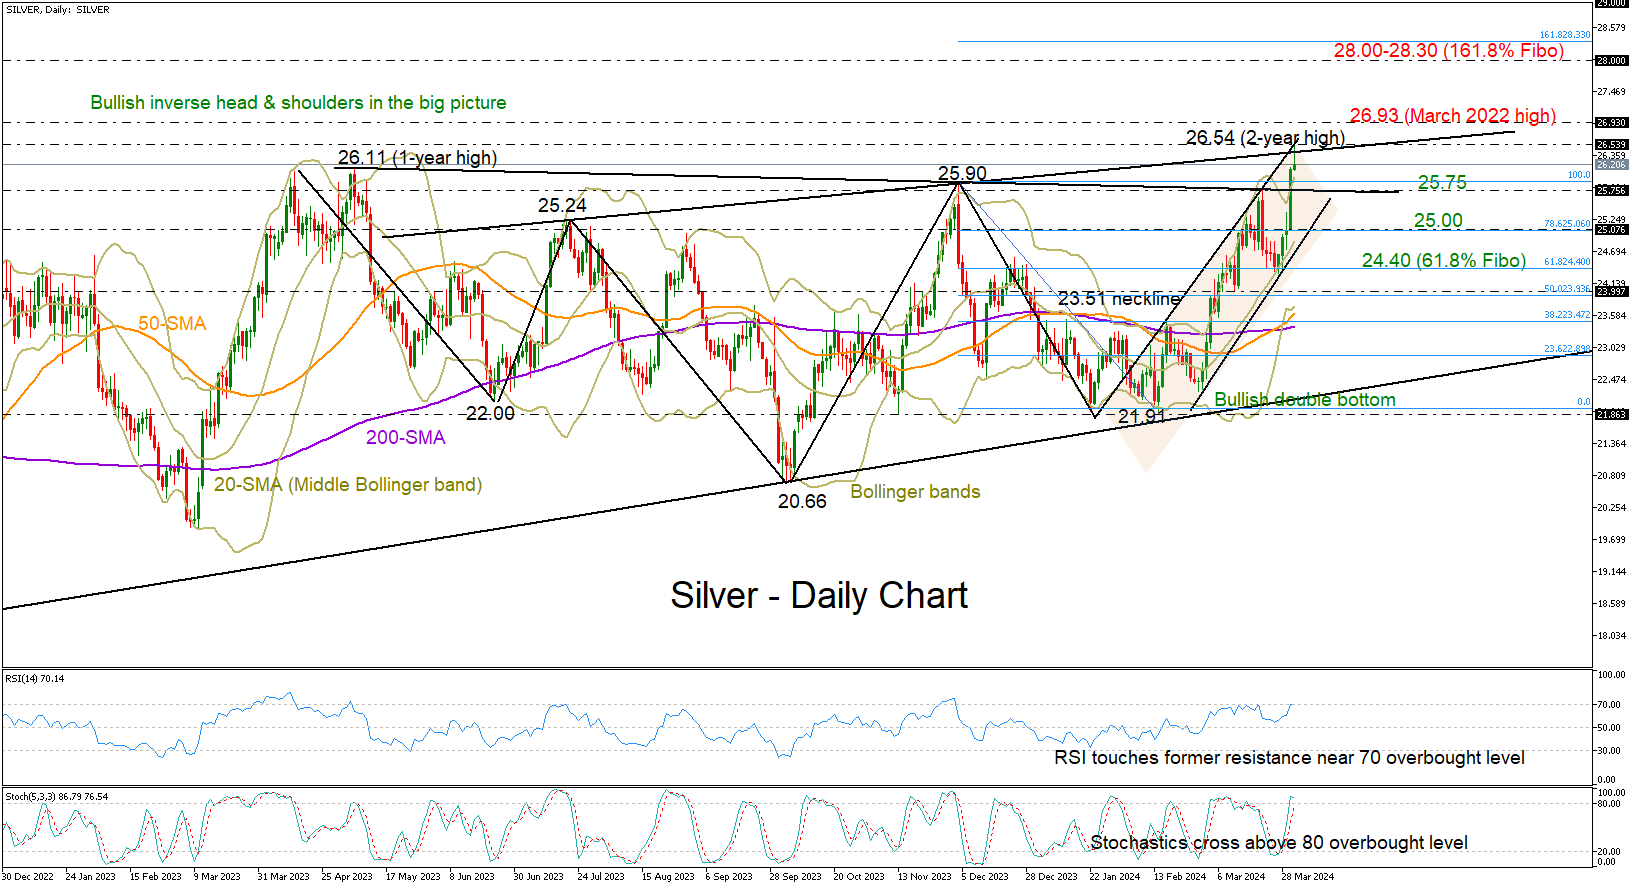
Posted on April 3, 2024 at 8:55 am GMT

Silver’s future prospects turn brighter after reaching a two-year peak A retreat fueled by profit-taking is a risk in the short term   Silver advanced to a two-year high of 26.54 on Wednesday, finally breaking the wide consolidation phase that started in May 2023. The spotlight is currently on the 2022 high of 26.93, however, Tuesday’s close above the upper Bollinger band implies a lack of strong bullish momentum. The RSI and the stochastic oscillator are also signaling a pause or a potential [..]

Technical Analysis – NZDUSD halts decline at 23.6% Fibonacci

Posted on April 3, 2024 at 8:07 am GMT

NZDUSD declines sharply within descending channel Drops below both 50- and 200-day SMAs to a 4-month low Oscillators remain deep in their negative territories   NZDUSD has been in an aggressive downtrend since its double rejection at the 0.6217 level in early March. Despite dropping to a fresh four-month bottom this week, the pair seems to be finding its footing around 0.5952, which is the 23.6% Fibonacci retracement of the 0.6536-0.5772 downtrend. Given that both the RSI and MACD are heavily tilted to the downside, the price [..]

Technical Analysis – GBPUSD battles with 200-day SMA

Posted on April 3, 2024 at 6:35 am GMT

GBPUSD drops below uptrend line Price remains within sideways channel MACD and RSI indicate neutral-to-bearish bias GBPUSD dropped beneath the long-term ascending trend line and the 200-day simple moving average (SMA). Nevertheless, it has not escaped the consolidation area of 1.2520-1.2820, which has confined the price action since November 24. Currently, the pair is trying to recoup some of the previous days’ losses, but the momentum is still weak. In case of a sell-off beneath the lower boundary of the range and the [..]

post-image

Technical Analysis – US 500 index retreats from record high

Posted on April 2, 2024 at 3:48 pm GMT

US 500 faces downside pressures for the second consecutive day More weakness possible, but key support levels are nearby   The US 500 stock index (cash) opened negative on Tuesday, strengthening its negative momentum towards its 20-day exponential moving average (EMA), which has been buffering downside movements since the start of the year, around 5,185. With the RSI marking a new low below an important support area and the stochastic oscillator decelerating, the odds for a bearish impulse have increased. [..]

Weekly Technical Outlook – USDJPY, EURUSD, USDCAD

Posted on April 2, 2024 at 8:59 am GMT

USDJPY struggles below 34-year high as NFP report awaited European Flash CPI to fall but will EURUSD extend recent decrease? Canada unemployment number predicted to rise; USDCAD looks for a rebound NFP report –> USDJPY The labor market has predominantly exhibited a positive trend, albeit with a steady decline that has caused the Federal Reserve to be concerned about potential overheating. However, a deceleration became more evident in February as the jobless rate increased to 3.9% and pay growth fell [..]

post-image

Technical Analysis – GBPUSD starts April with a drop

Posted on April 2, 2024 at 8:01 am GMT

GBPUSD moves sharply down on the first trading day of April 2024 neutral trajectory valid above 1.2500   GBPUSD plummeted to a six-week low of 1.2538 as investors returned from the Easter holiday break, re-establishing the downward pattern from the March high. Given the price’s position at the bottom of the 2024 range and around the lower Bollinger band, it will be intriquing to observe if the pair can avoid a bearish breakout even after getting another rejection from the [..]

Technical Analysis – EURJPY pulls back towards crucial trendline

Posted on April 2, 2024 at 7:00 am GMT

EURJPY retraces lower following a 16-year peak Tests ascending trendline drawn from July 2023 Oscillators suggest weakening momentum EURJPY had been in a steady advance since December 2023, peaking at a fresh 16-year high of 165.34 on March 20. Since then, the pair has been undergoing a downside correction, with the upward sloping trendline that connects higher lows since July 2023 currently acting as a strong support. Should the trendline fail to hold its ground, the pair could slide towards the recent [..]

post-image

Technical Analysis – Gold flies to consecutive record highs

Posted on April 1, 2024 at 8:06 am GMT

Gold advances sharply in the past few sessions Extends its streak of new all-time highs Momentum indicators suggest overbought conditions Gold has experienced a massive surge following its profound break above the 50-day simple moving average (SMA) in the beginning of March, generating a series of fresh record highs. However, an impending pullback could be on the cards as the short-term oscillators are flagging overbought signals. Should the rally persist, the price could resume its movement within uncharted waters, where the Fibonacci [..]

post-image

Technical Analysis – EURUSD’s recent bearish tendency to be tested this week

Posted on April 1, 2024 at 7:28 am GMT

EURUSD trades sideways in anticipation of this week’s key market events It remains below the various simple moving averages employed Momentum indicators support the current bearish move EURUSD is moving sideways today amidst a quieter start of the week due to the Easter Monday holiday observed in Europe. EURUSD has been on the retreat after repeatedly failing to break above the December 28, 2023 descending trendline and it is currently hovering below the 50-, 100- and 200-day simple moving averages [..]

post-image

Technical Analysis – USDCHF stays quiet below 20-SMA after core PCE data

Posted on March 29, 2024 at 1:56 pm GMT

US Core PCE inflation meets 2.8% forecast; monthly spending strengthens USDCHF shows no reaction; stays neutral at the bottom of a bullish channel Sellers are waiting below the 0.9000 mark   USDCHF did not respond dramatically to the core PCE inflation data, remaining congested at the lower boundary of a bearish channel in the four-hour chart. The pair has been flatlining below the 20-period simple moving average (SMA) at 0.9020 since yesterday, though downside risks are still alive as the technical indicators haven’t [..]

Risk Warning: Your capital is at risk. Leveraged products may not be suitable for everyone. Please consider our Risk Disclosure.