XM does not provide services to residents of the United States of America.

Technical Analysis

post-image

Technical Analysis – EURJPY meets resistance at 50-SMA as bearish forces persist

Posted on November 25, 2021 at 9:11 am GMT

EURJPY is continuing its descending trend after the October high amid successive lower highs. Moreover, the 50-period simple moving average (SMA) has crossed below the 200-period SMA completing a ‘death cross’ and increasing fears of a sustained bearish outlook. However, short-term oscillators are transmitting a cautiously positive bias. The RSI is hovering slightly above its 50 neutral mark, while the MACD is found above its red signal line and is looking ready to cross above zero, which would be another [..]

Technical Analysis – AUDUSD wipes out October’s gains; bias cautiously bearish

Posted on November 25, 2021 at 8:19 am GMT

AUDUSD has fully reversed October’s rise, with the price extending its decline marginally below the 0.7200 level and near the swing low of 0.7169 on Wednesday. The area overlaps with the broken descending trendline, which could switch roles from resistance to support in order to boost the pair up to the ascending trendline and the red Tenkan-sen, both currently around 0.7272. A steeper rebound could meet the 20- and 50-day simple moving averages (SMAs) near the 23.6% Fibonacci retracement of the 0.8006 – [..]

post-image

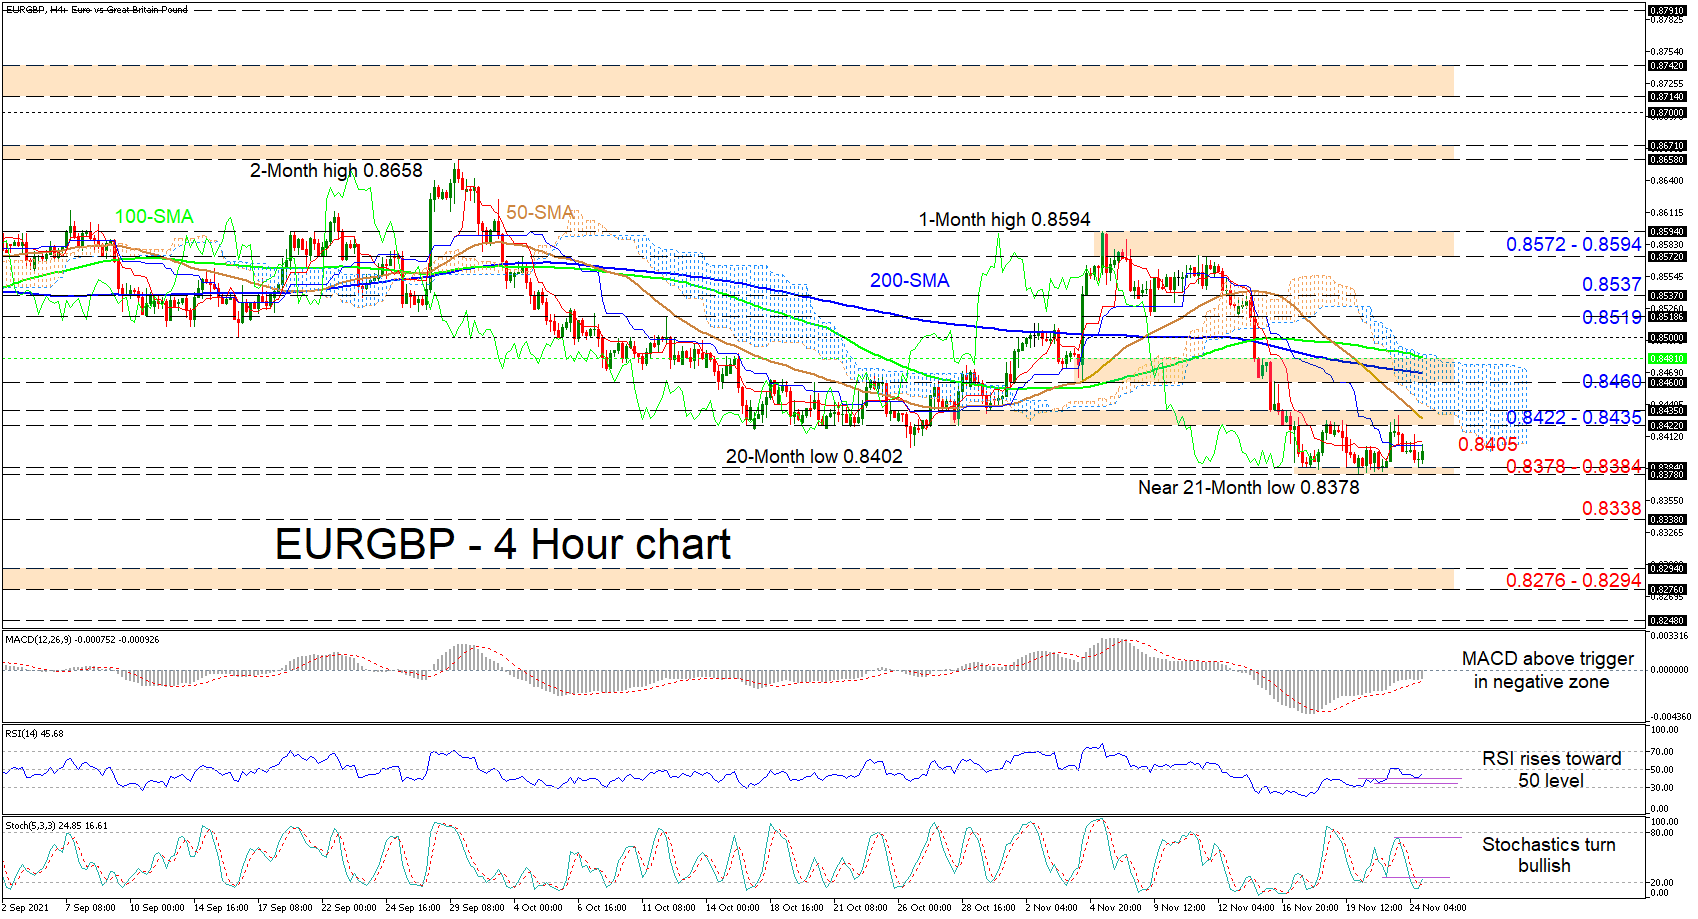
Technical Analysis – EURGBP consolidates around 21-month low

Posted on November 24, 2021 at 4:31 pm GMT

EURGBP is edging sideways across a support base shaped between the near 21-month low of 0.8378 and the 0.8384 barrier. The 100- and 200-period simple moving averages (SMAs) are endorsing the negative picture, while the diving 50-period SMA is indicating that the bearish trend has the upper hand. The Ichimoku lines are indicating that directional forces are somewhat lacking, whereas the short-term oscillators are suggesting bullish momentum is improving. The MACD, in the negative zone, continues to advance above its [..]

post-image

Technical Analysis – GBPJPY marks yet more lower highs as bearish forces linger

Posted on November 24, 2021 at 1:05 pm GMT

GBPJPY is struggling to gain positive traction amid successive lower highs. Moreover the 50-period simple moving average (SMA) has crossed below the 200-period SMA, increasing fears of a sustained bearish outlook. Short-term momentum indicators are reflecting a mixed picture for the pair, as the RSI is hovering slightly above its 50 neutral mark. However, the MACD is negligibly below its red signal line and is looking ready to cross beneath zero which would be another sign of negative momentum. Should [..]

post-image

Technical Analysis – Gold meets new resistance but sell-off already overstretched

Posted on November 24, 2021 at 11:02 am GMT

Gold could not find enough buying interest to close above the 1,796 resistance on Tuesday despite the bounce off the 20-day low of 1,781 in the four-hour chart. Nevertheless, traders could still derive some optimism from the momentum indicators as the RSI has formed a double bottom below its 30 oversold level, while the Stochastics are swiftly strengthening after printing a similar pattern below 20. The MACD is encouragingly swinging upwards in the negative area, reflecting fading selling forces. Hence, [..]

Technical Analysis – NZDUSD traces lower Bollinger, but neutral stance stands

Posted on November 24, 2021 at 10:05 am GMT

NZDUSD is following the declining lower Bollinger band and is confronting the October 13 inside swing low of 0.6910, after a one-month price drop from the 0.7200 vicinity, which steered beneath the simple moving averages (SMAs). The longer-term 100- and 200-day SMAs are reflecting the absence of a trend, while the dipping 50-day SMA, is mirroring the slight lead sellers have managed to secure. Despite the commanding sideways market in the pair, the short-term oscillators are skewed to the downside. [..]

post-image

Technical Analysis – EURCHF plummets in the long term but negative forces fade

Posted on November 24, 2021 at 9:52 am GMT

EURCHF has been trending downwards since March and is currently fluctuating near the 2-year low of 1.0446. Although the pair’s long-term outlook remains bearish, the near-term picture suggests that sellers are running out of steam. The short-term oscillators further confirm that buying pressure has risen. The MACD histogram has crossed above its red signal line in the negative area, while the RSI is ticking upwards below the 50-neutral mark. If bulls manage to get the upper hand, the price might meet immediate resistance [..]

post-image

Technical Analysis – US 500 retreats from all-time highs; bullish outlook

Posted on November 24, 2021 at 9:42 am GMT

The US 500 cash index witnessed a minor pullback in the past couple of sessions after recording an all-time high at 4,744. However, the overall picture remains bullish as the price is well above its 200-period simple moving average. The recent price depreciation that generated a negative bias, is reflected by the short-term momentum indicators.  The RSI is hovering below its 50 neutral mark, while the MACD is found below zero and its red signal line. Should the price break [..]

post-image

Technical Analysis – USDJPY inches up to fresh 4½-year high; next target at 115.50

Posted on November 24, 2021 at 8:28 am GMT

USDJPY ticked to a fresh 4½-year high of 115.22 early on Wednesday before easing slightly below the 115.00 level again. Previously, the price strengthened its bullish bias by bouncing forcefully near the 114.00 number and the 20-day simple moving average (SMA). Currently, the RSI is losing some momentum, indicating weakening buying pressures, though as long as it remains above its 50 neutral mark, the bulls may have new opportunities to drive the market higher. Note that the red Tenkan-sen line [..]

post-image

Technical Analysis – USDCAD runs out of steam at 8-week highs, rally at risk

Posted on November 23, 2021 at 2:49 pm GMT

USDCAD advances have encountered some downside pressure from the 1.2738-1.2755 obstacle, formed by the October 1 and September 30 highs, hinting that bullish powers may be subsiding. However, the soaring 50- and 100-period simple moving averages (SMAs) are still backing the uptrend in the pair. That said, the bullish Ichimoku lines are starting to signal minor waning in the upward drive as the red Tenkan-sen line’s incline falters, while the short-term oscillators are reflecting the increase in negative momentum. The [..]

Risk Warning: Your capital is at risk. Leveraged products may not be suitable for everyone. Please consider our Risk Disclosure.