XM does not provide services to residents of the United States of America.

Technical Analysis

Technical Analysis – GBPJPY plunges to 7-week low near 151.00

Posted on November 26, 2021 at 9:00 am GMT

GBPJPY is marking an aggressive declining move, with the price currently trading near a seven-week low and around the 151.00 psychological level.  The pair has dived beneath the 200-day simple moving average (SMA), and the technical indicators are confirming the latest descending move. The stochastic is falling towards the 20 level after posting a bearish crossover within the %K and %D lines, while the RSI is strengthening its negative momentum in the bearish area. More losses could take the market towards the 148.45-148.90 support region, while any moves [..]

Technical Analysis – USDCAD accelerates to fresh 3-month high

Posted on November 26, 2021 at 8:27 am GMT

USDCAD gained significant buying traction early on Friday – the largest daily increase since September –, with the price quickly recouping earlier losses to peak above Tuesday’s high of 1.2743. The positive slope in the RSI and the growing MACD are endorsing the current bullish momentum in the price, though with the former nearing its 70 overbought level and the key ascending line capping the market action, the bears could be around the corner. A decisive close above the ascending [..]

post-image

Technical Analysis – USDJPY slips from multi-year high but upside still intact

Posted on November 25, 2021 at 4:16 pm GMT

USDJPY has marginally retreated from a more than 4½-year high and directional impetus seems to have somewhat dried up. Nonetheless, the bullish tone in the simple moving averages (SMAs) continues to promote additional gains in the pair. The short-term oscillators are hinting that buyers are taking a breather, as the indicators appear to be suggesting that positive momentum is feeble. The MACD, some distance above the zero line, has retreated marginally below its red trigger line, while the RSI is [..]

post-image

Technical Analysis – US 30 retreats from all-time highs but bullish forces linger

Posted on November 25, 2021 at 11:21 am GMT

The US 30 cash index has witnessed a minor pullback from its all-time high at 36,560 earlier this month. However, the overall outlook for the index remains bullish as the price is found above its 200-period simple moving average (SMA). The short-term momentum indicators reflect a positive bias for the index. The RSI is located above its 50 neutral mark, while the MACD is currently above its red signal line and it has recently crossed above zero. Should the price [..]

post-image

Technical Analysis – UK 100 index pulls back from fresh highs; bullish bias holds

Posted on November 25, 2021 at 11:21 am GMT

The UK 100 stock index (cash) has been trending upwards since February. However, the index experienced a minor downside correction lately after its rally peaked at the 20-month high of 7,400. This recent pullback is unlikely to continue as the momentum indicators suggest that the bullish forces are still in play. The stochastic oscillator is sloping upwards near the 80-overbought area, while the RSI is hovering in the positive region. Should the buying pressure intensify further, the immediate hurdle for [..]

Technical Analysis – WTI futures bounce at 75 mark, broader bullish bias holds

Posted on November 25, 2021 at 10:07 am GMT

WTI oil futures are striving to overstep the curbing 50-day simple moving average (SMA) after the pullback from the 7-year high rebounded at the 75.00 handle. The 200-day SMA is defending the bigger bullish structure, while the 50 and 100-day SMAs are endorsing the short-term uptrend in the pair. The short-term oscillators are suggesting that the negative momentum may be running out of steam. The MACD is slightly in the negative region but is flattening below its red trigger line, [..]

post-image

Technical Analysis – USDCHF ticks higher as bullish forces consolidate

Posted on November 25, 2021 at 9:22 am GMT

USDCHF has been charging higher since June after the price failed to pierce through the 0.8925 region. Although the medium-term uptrend faced a moderate pullback in October, buyers retook control and pushed the price higher. The pair is likely to continue its ongoing ascent as the immediate bias seems bullish as well. The short-term oscillators further reinforce this view, with the MACD histogram being above both zero and its red signal line, while the RSI is flatlining near the 70-overbought [..]

post-image

Technical Analysis – EURJPY meets resistance at 50-SMA as bearish forces persist

Posted on November 25, 2021 at 9:11 am GMT

EURJPY is continuing its descending trend after the October high amid successive lower highs. Moreover, the 50-period simple moving average (SMA) has crossed below the 200-period SMA completing a ‘death cross’ and increasing fears of a sustained bearish outlook. However, short-term oscillators are transmitting a cautiously positive bias. The RSI is hovering slightly above its 50 neutral mark, while the MACD is found above its red signal line and is looking ready to cross above zero, which would be another [..]

Technical Analysis – AUDUSD wipes out October’s gains; bias cautiously bearish

Posted on November 25, 2021 at 8:19 am GMT

AUDUSD has fully reversed October’s rise, with the price extending its decline marginally below the 0.7200 level and near the swing low of 0.7169 on Wednesday. The area overlaps with the broken descending trendline, which could switch roles from resistance to support in order to boost the pair up to the ascending trendline and the red Tenkan-sen, both currently around 0.7272. A steeper rebound could meet the 20- and 50-day simple moving averages (SMAs) near the 23.6% Fibonacci retracement of the 0.8006 – [..]

post-image

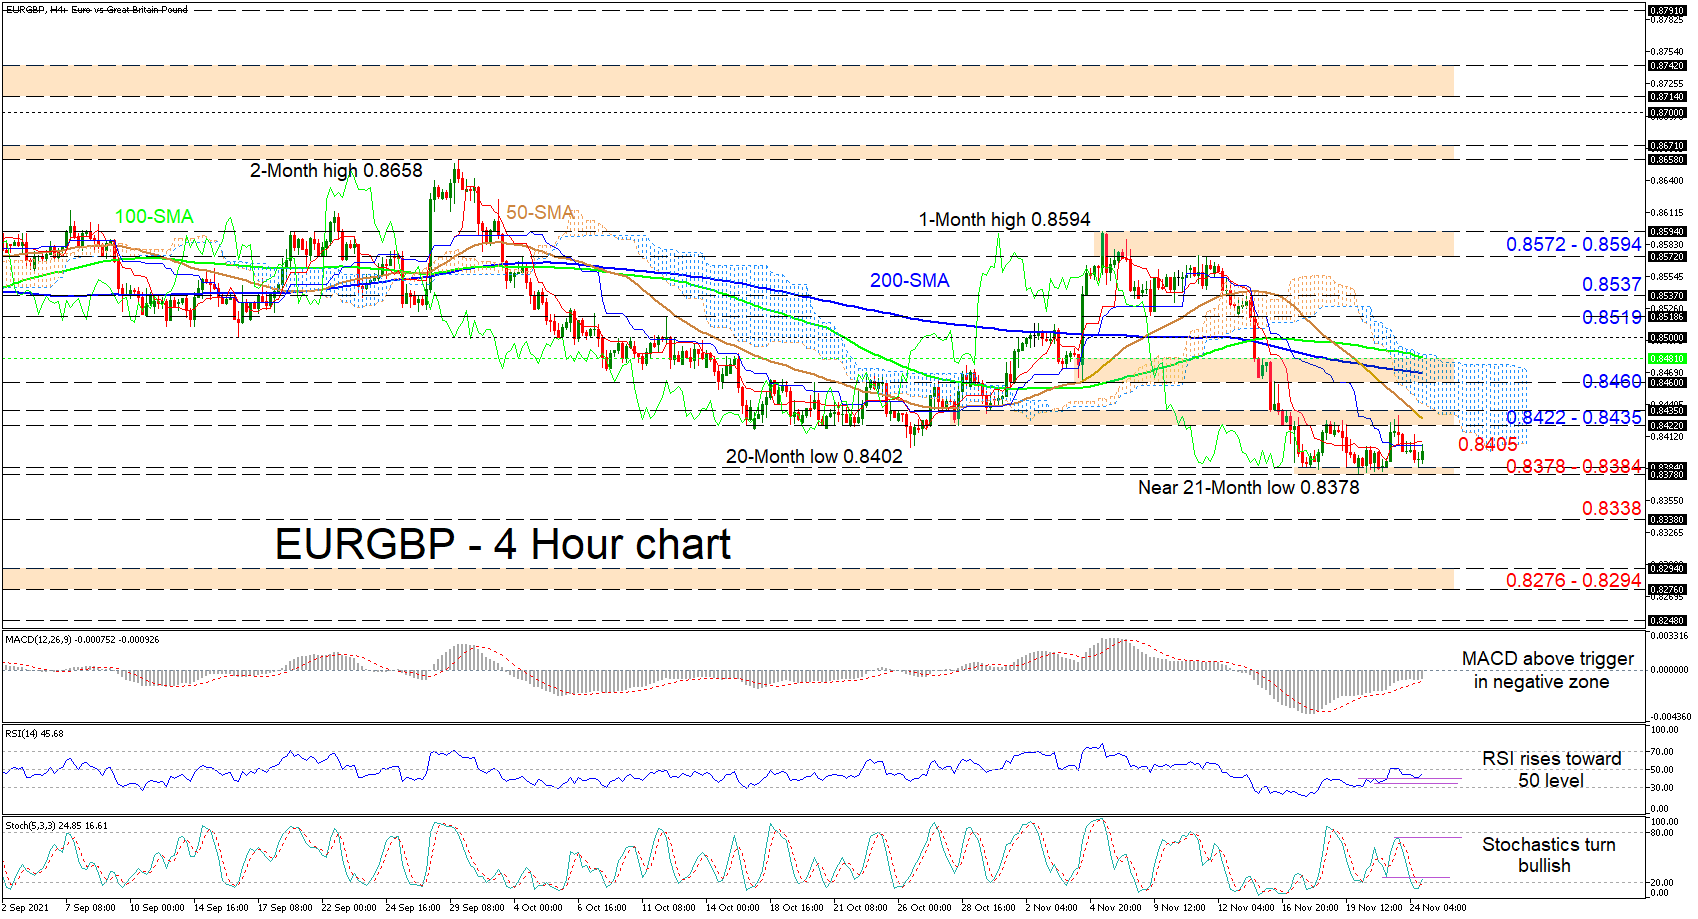
Technical Analysis – EURGBP consolidates around 21-month low

Posted on November 24, 2021 at 4:31 pm GMT

EURGBP is edging sideways across a support base shaped between the near 21-month low of 0.8378 and the 0.8384 barrier. The 100- and 200-period simple moving averages (SMAs) are endorsing the negative picture, while the diving 50-period SMA is indicating that the bearish trend has the upper hand. The Ichimoku lines are indicating that directional forces are somewhat lacking, whereas the short-term oscillators are suggesting bullish momentum is improving. The MACD, in the negative zone, continues to advance above its [..]

Risk Warning: Your capital is at risk. Leveraged products may not be suitable for everyone. Please consider our Risk Disclosure.