XM does not provide services to residents of the United States of America.

Technical Analysis

Technical Analysis – Gold’s collapse subsides but downside risks remain

Posted on January 31, 2022 at 8:50 am GMT

Gold has found some footing in the vicinity of the lower Bollinger band and recent trading session troughs, following a freefall in the commodity – due to a more aggressive message from the Federal Reserve regarding rate hikes – from 1,854, which extended below the simple moving averages (SMAs) and the 1,800 handle. The dipping 50-day SMA is reflecting that the trend in the commodity has become increasingly negative. The short-term oscillators are skewed to the downside but have yet [..]

Technical Analysis – EURUSD recoups some losses from 20-month low; broader outlook is bearish

Posted on January 31, 2022 at 8:24 am GMT

EURUSD rebounded off the 20-month low of 1.1120 that it posted in the previous week after the aggressive downside move below the short-term ascending trend line. Technically, the 20- and 40-day simple moving averages (SMAs) are ready for a bearish cross in the short-term, and the MACD oscillator is extending its bearish structure below its trigger and zero lines. However, the RSI indicator is pointing upwards in the negative region. A successful move higher, may find immediate resistance at the 1.1185 barrier ahead [..]

Technical Analysis – USDCAD rockets off 200-MA, fuelling upward trajectory

Posted on January 28, 2022 at 8:58 am GMT

USDCAD remains positively energized aiming for the Ichimoku cloud’s upper band around the 1.2813 high, after taking flight from the 200-day simple moving average (SMA) around the 1.2500 mark. The longer-term SMAs are suggesting an overall neutral trend in the pair, while the marginal incline in the 50-day SMA is sponsoring the recent rally from the 1.2500 level. Currently, the Ichimoku lines are converging, failing to indicate a leading directional force, while the short-term oscillators are skewed to the upside. [..]

post-image

Technical Analysis – US 30 index remains negative in short-term; SMAs post bearish cross

Posted on January 28, 2022 at 8:50 am GMT

The US 30 (Cash) index rebounded off the seven-month low of 33,145, gaining some momentum, but the short-term simple moving averages (SMAs) posted a bearish crossover. The RSI indicator is flattening near the oversold zone, while the MACD oscillator is losing ground below its trigger and zero lines. If price action remains above 33,940, there is scope to test 34,664, which the index failed to surpass in the previous day. Clearing this key level would see additional gains towards the 200-day SMA [..]

Technical Analysis – GBPJPY chases soft gains; short-term outlook somewhat gloomy

Posted on January 28, 2022 at 8:40 am GMT

GBPJPY found strong footing around its longer-term 50- and 200-day simple moving averages (SMAs) this week, but the price could only gradually strengthen to 154.80 since then, unable to recoup January’s losses. While the 50- and 200-day SMAs have escaped a bearish crossover, feeding speculation that the broad uptrend has not finished yet, the short-term outlook is still looking cloudy. Despite today’s buying appetite, the price continues to trade below its 20-day SMA at 155.68 and within the lower bearish [..]

post-image

Technical Analysis – GBPUSD continues its retreat, marking yet more lower lows

Posted on January 28, 2022 at 8:31 am GMT

GBPUSD continues its retreat from its January high, marking consecutive lower lows as negative forces linger. Moreover, the pair is currently trading below its 50- and 200-period simple moving average (SMA) with the former looking ready to cross below the latter, reinforcing fears of a sustained bearish outlook. Short-term momentum indicators are supporting a negative bias as the RSI is found well below its 50 neutral mark. Also, the MACD is found below zero and its red signal line, which [..]

post-image

Technical Analysis – Gold extends its retreat amid lingering bearish forces

Posted on January 28, 2022 at 7:22 am GMT

Gold has been experiencing a major pullback in the last few four-hour sessions, erasing most of its medium-term upside trajectory. The price profoundly crossed beneath both its 50- and 200-period simple moving averages (SMAs), endorsing bullion’s short-term bearish picture. This recent retreat is likely to resume as the momentum indicators depict that negative forces remain in charge. The MACD histogram is found beneath both zero and its red signal line, while the RSI is flatlining marginally above the 30-oversold mark. Furthermore, [..]

post-image

Technical Analysis – EURJPY consolidates as bearish tone softens

Posted on January 28, 2022 at 6:48 am GMT

EURJPY buyers are fighting back after recording a one-month low of 128.24, where a support base has developed during this past week. That said, the 200-period simple moving average (SMA) is endorsing a broader neutral bias, while the bearish 50- and 100-period SMAs are defending the descent in the pair. Worth mentioning is a nearing bearish crossover of the 200-period SMA by the 100-period one, which would confirm selling interest has ramped up. The Ichimoku lines are indicating that downward [..]

post-image

Technical Analysis – Palladium futures at risk of pullback after aggressive rally

Posted on January 27, 2022 at 1:24 pm GMT

Unlike other metals, Palladium futures (March delivery) staged an extraordinary rally to re-enter the 2,000 zone following the 20-day simple moving average (SMA) at 1,888 last week but the market is not out of the woods yet. Although the price has marked a new higher high at 2,374 on Wednesday, questioning the negative pattern in the market, the 200-day SMA and the descending trendline overhead, which holds the downtrend from the record high of 3,016 intact, are threatening to ruin the bullish party [..]

post-image

Technical Analysis – Amazon erases 2021 record rally; bearish but oversold

Posted on January 27, 2022 at 11:50 am GMT

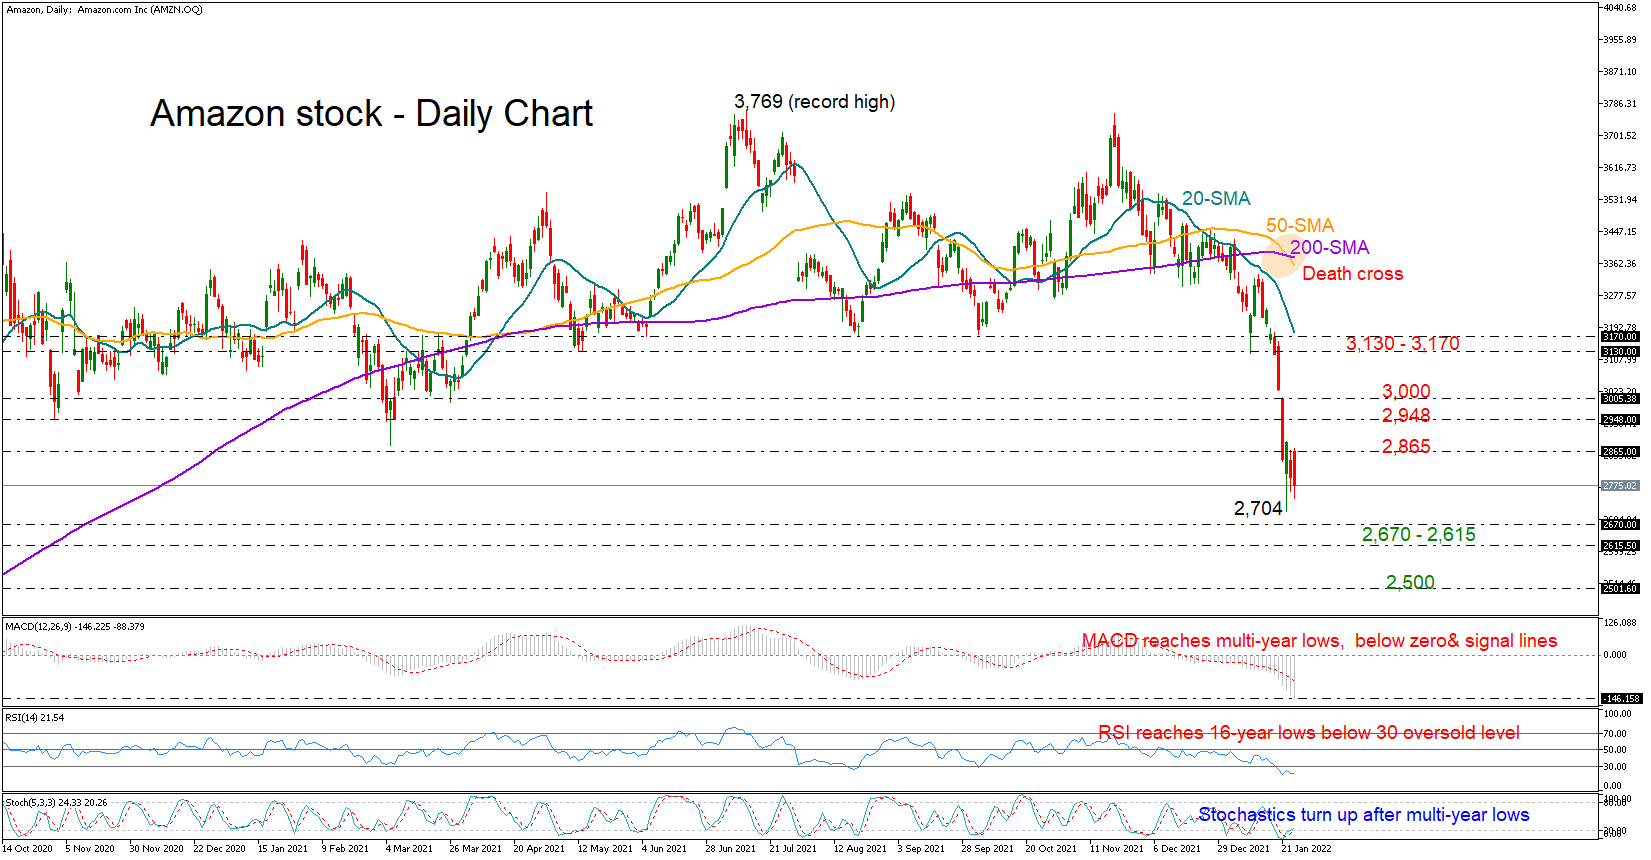
Amazon’s stock has fully canceled its 2021 record rally in just a week, diving by more than 14% to a 1½-year low of 2,704 on Wednesday. The freefall in the price has breached the broad sideways trajectory in the market, and the progressing death cross between the 50- and 200-day simple moving averages (SMAs) is a worrying sign that the market could remain trapped within the downward trajectory for longer. The question that arises at this point is whether the slump is [..]

Risk Warning: Your capital is at risk. Leveraged products may not be suitable for everyone. Please consider our Risk Disclosure.