XM does not provide services to residents of the United States of America.

Technical Analysis

Technical Analysis – WTI futures surge past 100 mark sparked by Russia’s attacks on Ukraine

Posted on February 24, 2022 at 10:50 am GMT

WTI oil futures have pierced above the 100 dollar per parrel mark after starting the day with a quarter of a dollar gap higher, before rocketing past the previous multi-year high of 95.00. The ascending simple moving averages (SMAs) are endorsing the uptrend from the 14-week low of 62.25, reinforcing the broader positive structure. The soaring Ichimoku lines are indicating that bullish forces continue to remain fired up, while the short-term oscillators reveal no signs of vulnerability in positive momentum. [..]

post-image

Technical Analysis – EURUSD plunges below 1.1200, posting 3-week low

Posted on February 24, 2022 at 10:45 am GMT

EURUSD is tumbling below the 1.1200 psychological level, reaching a new three-week low. The price pulled back off the simple moving averages (SMAs) creating a strong selling interest. The RSI indicator is reaching the oversold territory, while the MACD is strengthening its negative momentum below its trigger and zero lines. If the price plunges further, the next stop could be around the 20-month low of 1.1120. Steeper decreases in the market could meet the inside swing high of April 2020 [..]

post-image

Technical Analysis – JP 225 index dives to 15-month low; tests bearish channel

Posted on February 24, 2022 at 10:42 am GMT

Japan’s 225 stock index (cash) joined the Ukrainian-led global stock sell-off on Thursday, though less forcefully, with the price currently fighting to stay within the bearish channel despite its flash drop to a 15-month low of 25,557 earlier in the day. The RSI and the Stochastics are signaling oversold conditions, but until the indicators start to show clear signs of improvement, the bears may keep leading the market with scope to reach the nearby support region of 25,300 from November 2020. If the [..]

post-image

Technical Analysis – Brent crude shoots above 100; 2014 levels in the spotlight

Posted on February 24, 2022 at 8:59 am GMT

Brent crude futures (April delivery) skyrocketed to 103.73 on Thursday for the first time since 2014, gaining around 7.0% on the day on news Russia launched military attacks on Ukraine. The price is hovering marginally below the key 105.00 – 105.50 floor, where the market was well supported during the 2010 – 2014 period. Hence, some congestion within the region could be essential as the price is sailing in overbought waters according to the RSI. That said, the clear uptrend in [..]

post-image

Technical Analysis – EURJPY hits the lower Bollinger Band; bearish forces linger

Posted on February 24, 2022 at 8:52 am GMT

EURJPY has witnessed a major pullback, recording yet more lower lows as negative forces linger. Moreover, the 50-period simple moving average (SMA) is looking ready to cross below the 200-period SMA, reinforcing fears of a sustained bearish outlook. However, the pair is currently trading below its lower Bollinger Band indicating that an immediate upside move should not be ruled out. Short term momentum indicators are reflecting a negative bias as the RSI is currently located slightly above its 30 oversold [..]

post-image

Technical Analysis – USDCHF ticks upwards after its short-term decline pauses

Posted on February 24, 2022 at 8:41 am GMT

USDCHF has been trying to recoup part of its recent losses since it managed to find its feet at the 0.9150 region. Although the pair experienced a minor pullback, it is marching higher again as positive momentum seems to be intensifying. The short-term oscillators indicate that near-term risks are tilted to the upside. The stochastic oscillator is nudging higher after posting a bullish cross, while the MACD histogram has jumped above its red signal line but remains in the negative [..]

Technical Analysis – AUDUSD returns back below the falling trend line

Posted on February 24, 2022 at 8:35 am GMT

AUDUSD is heading south after failing to have a closing day above the 0.7250 resistance and touching the 40-day simple moving average (SMA) lower. The MACD oscillator is losing momentum above its trigger and zero lines, while the RSI is sloping down near the neutral threshold of 50 in the short-term. Further declines may meet support around the 20-day SMA at 0.7145 before tumbling to the 0.7050 support. Not far below, support could occur around the 0.6990 barier, while even [..]

post-image

Technical Analysis – Silver confronts 200-MA and upper Bollinger band

Posted on February 23, 2022 at 3:56 pm GMT

Silver is simultaneously overpowering the 200-day simple moving average (SMA) at 24.22 and the adjacent upper Bollinger band around 24.44 trying to reel in the overhead high of 24.69 and the 25.20-25.39 ceiling of the near five-month sideways market. The gliding 200-day SMA is endorsing a bearish tone but has failed to suppress growing upside impetus, while the upturn in the slopes of the 50- and 100-day SMAs, suggests the minor price rally from the 21.93-22.13 support section may be [..]

post-image

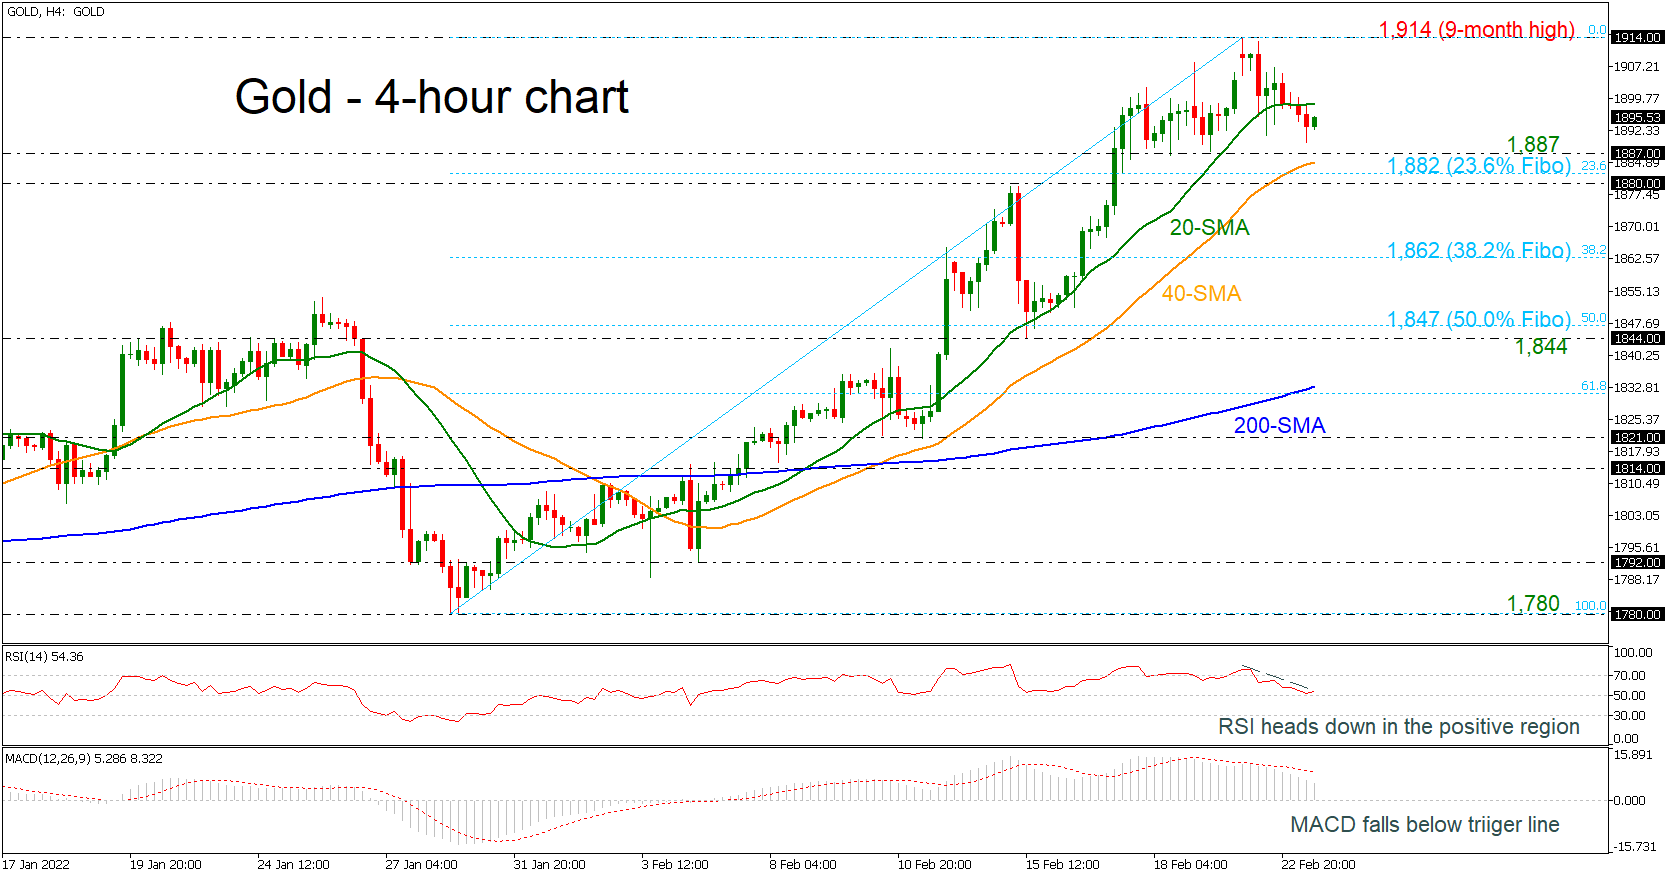
Technical Analysis – Gold eases below 20-period SMA, creating bearish correction

Posted on February 23, 2022 at 11:02 am GMT

Gold prices are in a declining mode after the bounce off the nine-month high of 1,914. The price fell beneath the 20-period simple moving average (SMA) with the technical indicators suggesting a bearish correction. The RSI is holding below a descending line in the positive region, while the MACD oscillator is losing momentum below its trigger line in the bullish area. A reversal to the downside could stall at the 1,887 support ahead of the 40-period simple moving average (SMA) at [..]

Technical Analysis – NZDUSD’s fresh bullish impetus put under the microscope

Posted on February 23, 2022 at 10:09 am GMT

NZDUSD is set to confront the Ichimoku cloud’s lower band, which intersects with a potential restrictive trend line pulled from the 0.7216 high, putting the durability of the progressive price bounce from the 16-month low of 0.6528 to the test. The longer-term 100- and 200-day simple moving averages (SMAs) are defending a more than three-month decline, while the calmer downward slope of the 50-day SMA is reflecting buyers’ recent efforts to oppose the negative picture. The red Tenkan-sen line is [..]

Risk Warning: Your capital is at risk. Leveraged products may not be suitable for everyone. Please consider our Risk Disclosure.