XM does not provide services to residents of the United States of America.

Technical Analysis

post-image

Technical Analysis – Microsoft’s stock completes a ‘death cross’ as negativity persists

Posted on March 15, 2022 at 3:08 pm GMT

Microsoft’s stock continues its downtrend move, recording successive lower lows and lower highs as negative forces linger. Moreover, the 50-day simple moving average (SMA) has crossed below the 200-day SMA completing a ‘death cross’, reinforcing the thesis for a sustained bearish outlook. The short-term momentum indicators are reflecting a negative bias too as the RSI is located below its 50 neutral mark. Also the MACD is found below zero and its red signal line, which indicates that the negative momentum [..]

post-image

Technical Analysis – EURJPY battles to overpower 200-MA

Posted on March 15, 2022 at 10:18 am GMT

EURJPY is confronting the simple moving averages (SMAs) around the 130.00 price region after recently rocketing from a 15-month low of 124.38 – an upward move that has recouped more than fifty percent of the collapse from the 133.14 peak. Currently, the dipping SMAs are not reflecting a convincing trend but have managed to curb additional gains in the pair. Nonetheless, the short-term oscillators are indicating strengthening positive momentum in the pair. The MACD, in the negative zone, has distanced [..]

post-image

Technical Analysis – AUDUSD halts decline but negative forces linger

Posted on March 15, 2022 at 9:15 am GMT

AUDUSD has been experiencing a sharp drop in the last four-hour sessions , crossing below both its 50- and 200-period simple moving averages (SMAs). Although the pair managed to pause its downfall, the technical picture endorses a bearish immediate-term bias. The short-term oscillators suggest that negative forces remain in control. The MACD histogram is currently below both zero and its red signal line, while the RSI is ticking slightly up in the negative zone after rebounding from the oversold area. [..]

post-image

Technical Analysis – US100 hits the lower Bollinger Band; bearish outlook remains

Posted on March 15, 2022 at 8:30 am GMT

The US 100 cash index continues its descending trend, reaching a 10-month low as elevated negative pressures persist. Moreover, the index is currently trading by over 20% below its November all-time highs and well below its 50- and 200-day simple moving averages (SMAs), reinforcing the bearish outlook argument. The short-term momentum oscillators are reflecting a negative bias too as the RSI is steady below its 50 neutral mark. Also, the MACD is increasing below zero and its red signal line, [..]

Technical Analysis – GBPUSD holds near 16-month low of 1.3000

Posted on March 15, 2022 at 7:41 am GMT

GBPUSD is posting a selling interest move, testing the 1.3000 psychological level, which is a fresh 16-month low. The RSI indicator is pointing upwards in the oversold zone, while the stochastic oscillator created a bullish crossover within its %K and %D lines below the 20 level. Both are suggesting that the bearish mode has come to an end and the next move may be to the upside. If the price recovers and returns above the 1.3080 resistance, the next target [..]

post-image

Technical Analysis – EURCHF recovers from multi-year low just under the 1.00 mark

Posted on March 14, 2022 at 3:15 pm GMT

EURCHF has established a foothold around 1.0182 and above the 1.0123 level, which is the 23.6% Fibonacci retracement of the down wave from 1.0610 until a more than 7-year low of 0.9971, signalling that buyers are starting to reap some rewards from the recent bounce in the pair. Despite the fresh progress in the pair, the descending simple moving averages (SMAs) are backing the one-year decline from the 1.1151 high. The Ichimoku lines are indicating a significant dry up in [..]

post-image

Technical Analysis – UK 100 remains volatile amid an overall bearish outlook

Posted on March 14, 2022 at 2:27 pm GMT

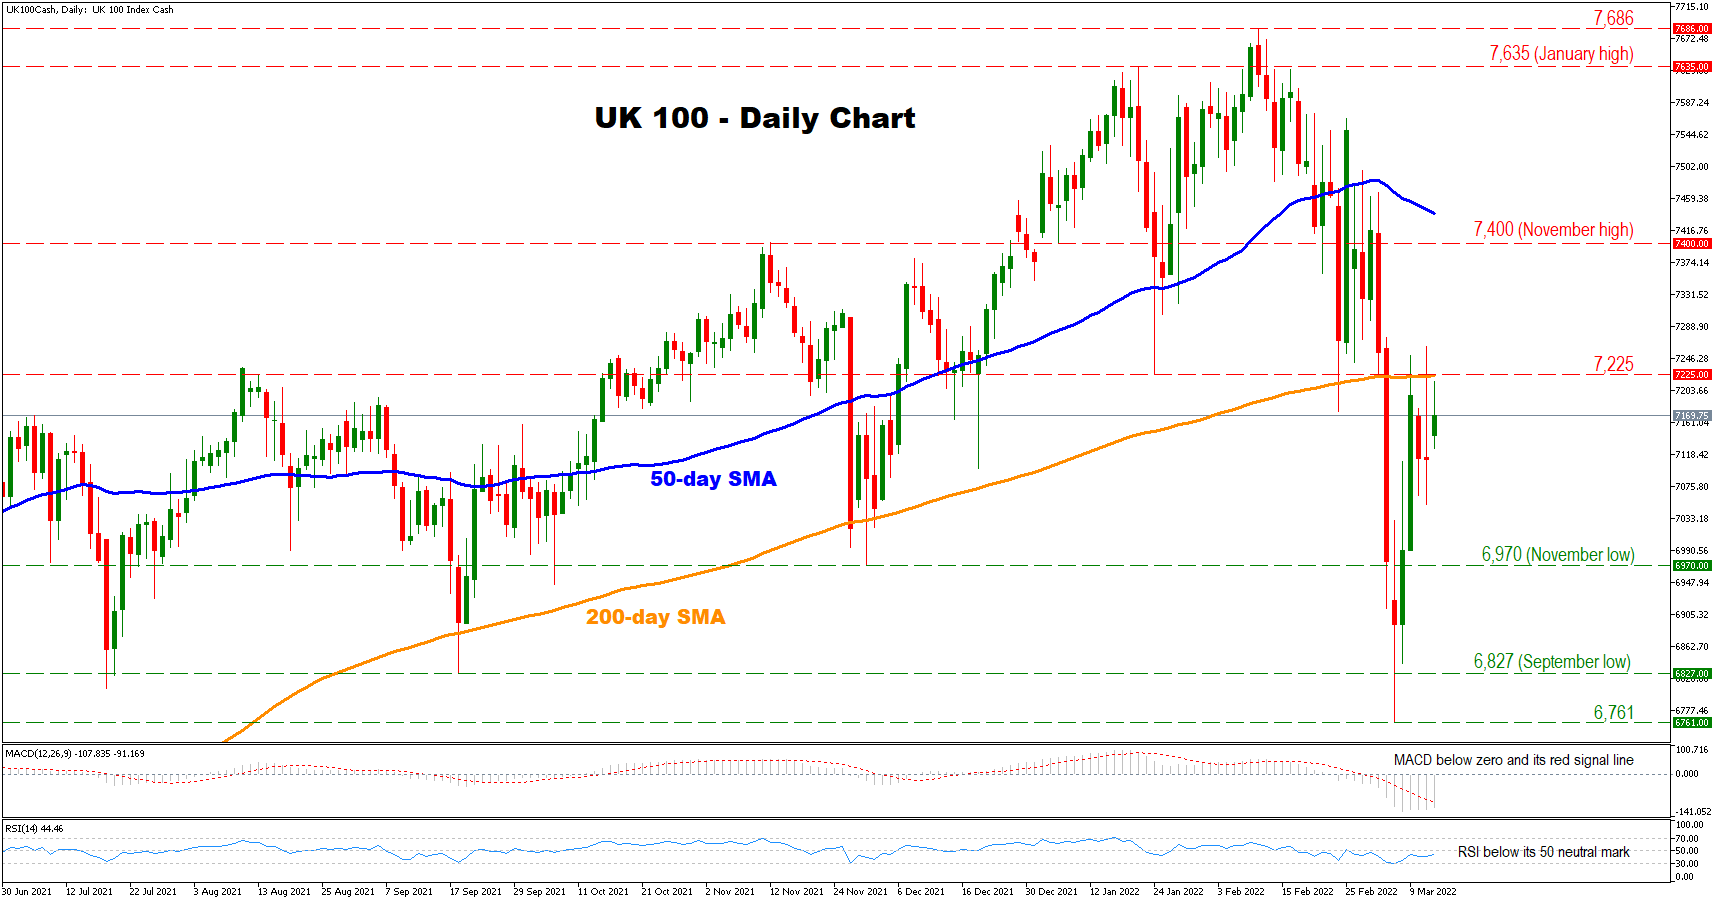
The UK 100 cash index has recouped some of its March losses during the last few trading sessions. However, this month’s violent losses have pushed the index below its 50- and 200-day simple moving averages (SMAs), reinforcing the thesis of an overall bearish outlook. The short-term momentum indicators are painting a negative picture too as the RSI is located below its 50 neutral mark. Also, the MACD is found below zero and its red signal line, which indicates that the [..]

post-image

Technical Analysis – Platinum futures retreat after peaking at 9-month high

Posted on March 14, 2022 at 2:12 pm GMT

Platinum futures (April delivery) have been experiencing a pullback after their medium-term upside trajectory ceased at the fresh nine-month high of 1,195. Although the 50-day simple moving average (SMA) recently posted a bullish cross above the 200-day SMA, the technical picture seems to be deteriorating for the commodity. The short-term oscillators suggest that near-term risks are tilted to the downside. The MACD has dipped below its red signal line but remains in the positive region, while the RSI is sloping [..]

Technical Analysis – Gold finds feet at 38.2% Fibonacci but downside risks linger

Posted on March 14, 2022 at 10:49 am GMT

Gold’s downward pressures are weighing on the 1,959 level, which is the 38.2% Fibonacci retracement of the recent 1,780-2,070 rally. Despite the deep retreat in the price of the commodity, the bullish simple moving averages (SMAs) continue to endorse the ascent in the precious metal. Meanwhile, the short-term oscillators are skewed to the downside, confirming that positive impetus is fading. The MACD is far north of the zero threshold and looks set to slide beneath its red trigger line, while [..]

post-image

Technical Analysis – US 500 index rangebound as bearish bias prevails

Posted on March 14, 2022 at 9:28 am GMT

The US 500 stock index (cash) has recovered some lost ground after its short-term decline ceased at the 4,150 region. However, in the last few four-hour sessions, its ongoing rebound seems to be faltering as the price has adopted a more sideways pattern. The momentum indicators suggest that bearish forces remain in charge. The RSI is flatlining in the negative zone, while the MACD histogram is found below both zero and its red signal line. Moreover, the price is trading beneath the [..]

Risk Warning: Your capital is at risk. Leveraged products may not be suitable for everyone. Please consider our Risk Disclosure.