XM does not provide services to residents of the United States of America.

Technical Analysis

post-image

Technical Analysis – WTI oil futures exit sideways move to the downside

Posted on April 18, 2024 at 8:19 am GMT

WTI oil futures complete bearish triangle pattern after Wednesday’s drop Bullish pressures could still resurface as long as the price holds above 81.50   WTI oil futures tumbled by 2.8% to 82.84 on Wednesday, experiencing one of their biggest daily losses so far this year after a short-period of consolidation. The price slid below the key support of 84.14 and the 20-day exponential moving average (EMA), dissolving a descending triangle to the downside. This is usually a bearish chart pattern, [..]

post-image

Technical Analysis – GBPCAD hits a wall but bulls not ready to give up

Posted on April 17, 2024 at 2:33 pm GMT

GBPCAD keeps knocking on 1.7238 door But bulls unable to break through it yet Momentum stays positive for now   GBPCAD has been trying to get past the tough wall around 1.7238 for more than a week now, but each time it has been knocked back. However, after dipping below its 50- and 20-day simple moving averages (SMA) in the preceding days, positive momentum has been restored. The stochastics have turned upwards and are positively aligned, while the RSI has [..]

post-image

Technical Analysis – EURGBP maintains bearish bias amid pennant formation

Posted on April 17, 2024 at 12:08 pm GMT

EURGBP tests uptrend line as it resumes slide Risks are tilted to the downside But pennant pattern suggests more consolidation   EURGBP has been drifting lower after its latest attempt to break above the medium-term descending trendline failed, peaking at 0.8585. The price briefly touched the short-term uptrend line just below 0.8520 earlier today before bouncing higher. But as it remains below its 20- and 50-day simple moving averages (SMA), the risks are tilted to the downside, and this is [..]

post-image

Technical Analysis – Gold struggles to jump above 2,400

Posted on April 17, 2024 at 9:24 am GMT

Gold finds support at mid-level of Bollinger band Technical oscillators remain in positive territory Gold prices are finding strong obstacles to surpass the 2,400 resistance level despite the spike towards the record peak of 2,431.48 in the preceding week. The price is still standing at the upper half boundary of the Bollinger band and the technical oscillators are indicating more gains. The MACD oscillator is trying to move above its trigger line in the positive territory, while the RSI is [..]

post-image

Technical Analysis – USDJPY on the verge of hitting 155.00 milestone

Posted on April 17, 2024 at 8:12 am GMT

Overbought signals persist as USDJPY approaches the 155.00 level Bullish trend expected to hold strong above 151.00   After an explosive bullish session on Monday, USDJPY is now a short distance below the 155.00 psychological level, recording its sixth consecutive week of gains and reaching its highest level since May 1990. The RSI and the stochastic oscillator are currently losing momentum in the overbought region, flagging a potential slowdown in the market. Due to the substantial price increase in the past week, Japan may consider [..]

post-image

Technical Analysis – NZDUSD bounces off 5-month low

Posted on April 17, 2024 at 7:11 am GMT

NZDUSD posts some gains after negative days Immediate resistance at 0.5940 Stochastics and RSI tick higher NZDUSD rebounded off the five-month low of 0.5858 after three straight negative days with the technical oscillators confirming that an upside recovery may be on the cards. The RSI is pointing north near the 30 level, while the stochastic posted a bullish crossover within its %K and %D lines. Immediate resistance is coming from the 0.5940 barrier ahead of the 20-day simple moving average (SMA) at 0.5980. If [..]

post-image

Technical Analysis – EURCHF ticks up after strong losses

Posted on April 16, 2024 at 9:35 am GMT

EURCHF remains beneath uptrend line MACD and RSI momentum weakens EURCHF is recovering some losses after the bearish gap that opened on Monday, remaining beneath the steep rising trend line. The pair may be ready for a bearish correction, mirrored by the technical oscillators. The RSI is flattening beneath the neutral threshold of 50, while the MACD is standing beneath its trigger line in the positive region. More losses could send the pair until the 50-day simple moving average (SMA) at 0.9640 ahead of [..]

post-image

Technical Analysis – JP 225 index tests crucial support zone

Posted on April 16, 2024 at 9:06 am GMT

JP 225 index pulls back from its all-time high Drops below 50-day SMA to face March support Momentum indicators are skewed to the downside The JP 225 index (cash) has been experiencing a downside correction after posting a fresh all-time high of 41,147 on March 21. In the near term, the price has declined beneath its 50-day simple moving average (SMA), while currently testing the March support of 38,300. Should the price break below the crucial 38,300 zone, the bears could attack the January resistance of [..]

post-image

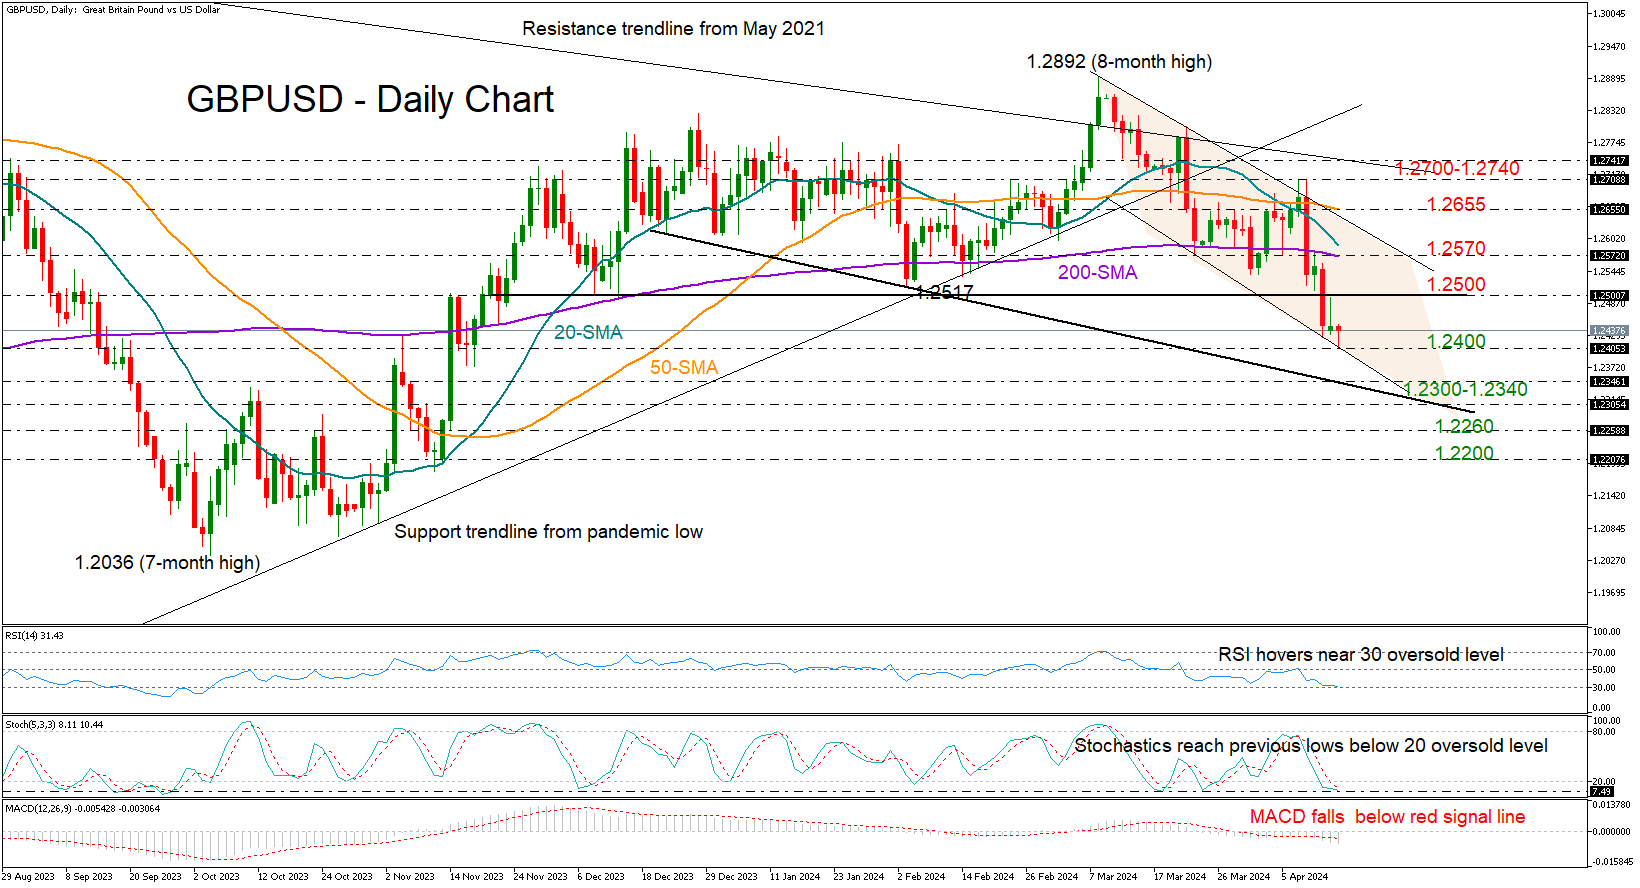
Technical Analysis – GBPUSD pulls back into the negative zone

Posted on April 16, 2024 at 8:16 am GMT

GBPUSD inches down to a new five-month low An extension below 1.2400 could generate fresh selling interest     GBPUSD tried to breach the psychological barrier at 1.2500 and re-establish itself within the 1.2488-1.2892 range. But its efforts proved unsuccessful, with the pair charting a new lower low of 1.2405 during Tuesday’s early trading hours – the lowest level since November 2023. The bears might take a breather soon as the stochastic oscillator has reached its previous support area below [..]

post-image

Technical Analysis – AUDUSD breaks the lower bound of a sideways range

Posted on April 16, 2024 at 7:35 am GMT

AUDUSD extends slide after breaking lower bound of range MACD and RSI detect bearish momentum Break below 0.6390 could aim for 0.6335 Recovery above 0.6500 could signal return within range AUDUSD extended its tumble on Monday and during the Asian session Tuesday, falling below the key support barrier of 0.6455. On Friday, the pair broke below the lower end of a sideways range that was containing most of the price action since mid-January, and the dip below 0.6455 may have [..]

Risk Warning: Your capital is at risk. Leveraged products may not be suitable for everyone. Please consider our Risk Disclosure.