XM does not provide services to residents of the United States of America.

Technical Analysis

post-image

Technical Analysis – Natural gas futures tick higher as bullish forces linger
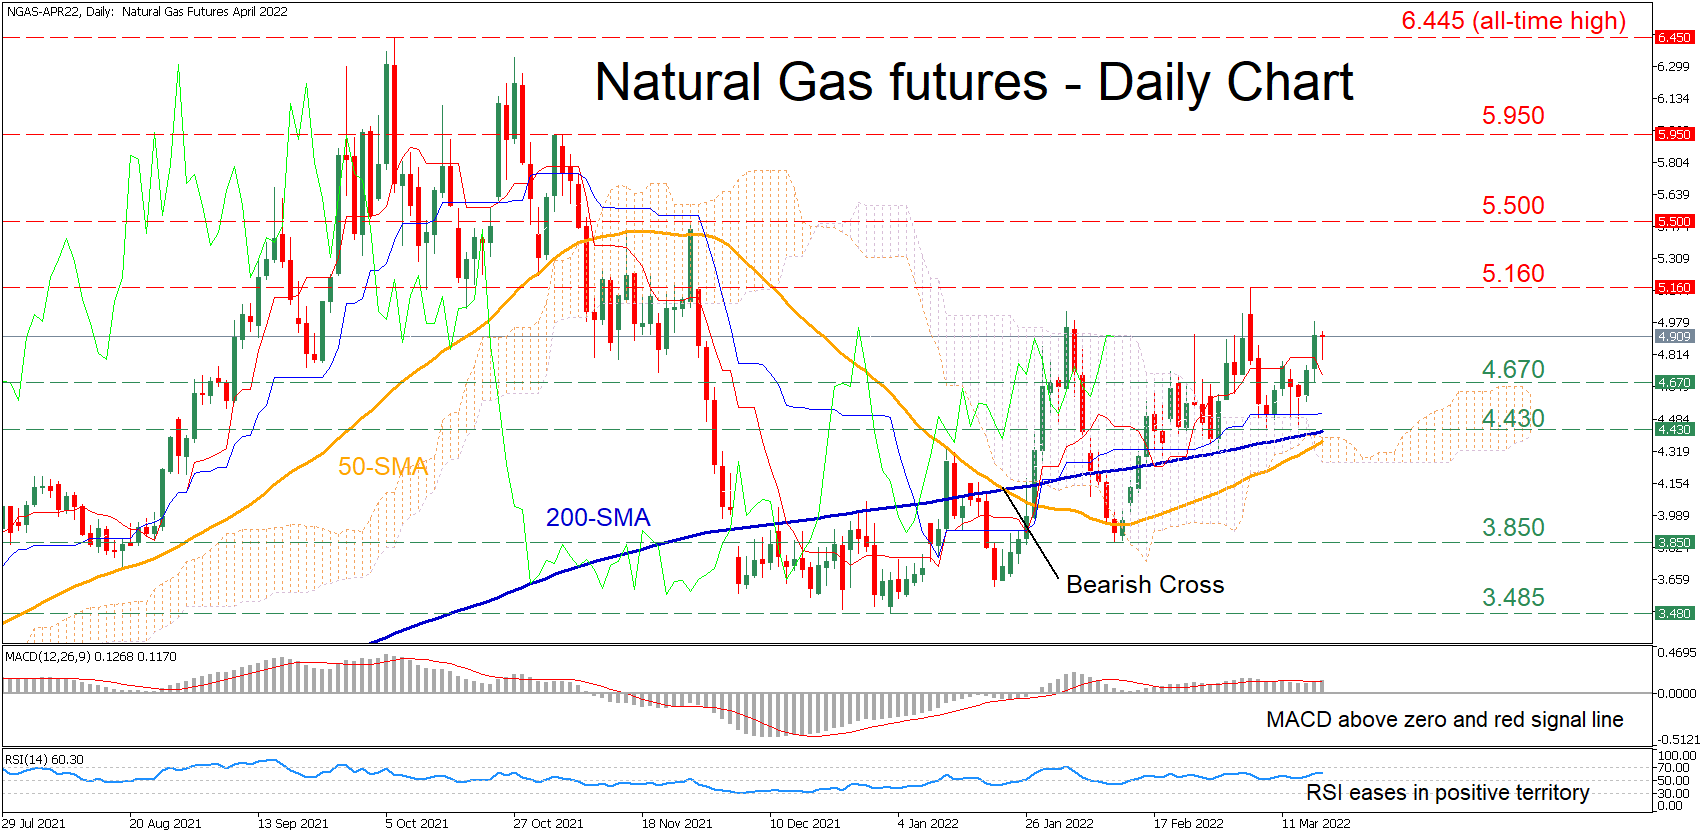
Posted on March 18, 2022 at 1:57 pm GMT

Natural gas futures (April 2022 delivery) have been creeping higher in the short term after their long-term downtrend ceased at the 3.485 region in December. Moreover, the ascending 50-day simple moving average (SMA) is closing the gap with the 200-day SMA, where a potential crossover could endorse the case of a broader rally. The short-term oscillators suggest that buyers have gained the upper hand. The MACD histogram is currently above both zero and its red signal line, while the RSI is hovering beyond its [..]

Technical Analysis – GBPJPY eyes nearby ceiling after extending above MAs

Posted on March 18, 2022 at 11:30 am GMT

GBPJPY is targeting the 156.77 barrier after maintaining a two-week climb from the 150.96 low, which also managed to overstep the simple moving averages (SMAs). For some time now, the SMAs have been lacking a distinct trend as the pair has mostly been trading between the 148.45 and 158.20 price limits. The short-term oscillators are revealing a neutral-to-bullish price mood in the pair. The MACD, has deviated away from its red trigger line, which is in the negative zone, and [..]

post-image

Technical Analysis – EURAUD plunges below 1.5000, pausing its move near 23.6% Fibo

Posted on March 18, 2022 at 10:19 am GMT

EURAUD found strong resistance level at the 1.5330 barrier, which acted as a turning point to the price, holding the pair beneath the 20-day simple moving average (SMA) as well. Currently, the price is testing the 23.6% Fibonacci retracement level of the down leg from 1.6235 to 1.4560 at 1.4953 and any falls below it would endorse the short- and medium-term bearish outlook. The RSI indicator is falling further in the negative territory, while the MACD successfully surpassed above its [..]

post-image

Technical Analysis – CHFJPY storms to fresh multi-year highs

Posted on March 18, 2022 at 9:12 am GMT

CHFJPY has been marching higher in the long term, generating a clear structure of higher highs and higher lows. Although the pair experienced a minor pullback recently, the short-term picture seems to be improving again, with the pair powering back to fresh highs. The short-term oscillators suggest that bullish forces remain in control. The MACD histogram is currently above both zero and its red signal line, while the RSI is sloping upwards in the positive territory. Should the positive momentum [..]

post-image

Technical Analysis – USDCHF pauses decline after channel breakout

Posted on March 18, 2022 at 8:45 am GMT

USDCHF exited forcefully the two-week-old bullish channel on the downside on Monday, but the 50-period simple moving average (SMA) on the four-hour chart and the 38.2% Fibonacci retracement of the 0.9162 – 0.9459 upleg, which is slightly higher at 0.9346, came to the rescue, helping the price to pivot northwards again. While the price’s rebound on the lower Bollinger band and the positive slope in the Stochastics, which recently left the oversold territory, endorse further improvement in the market, some [..]

post-image

Technical Analysis – GBPUSD bias improves but the overall outlook remains bearish

Posted on March 18, 2022 at 8:37 am GMT

GBPUSD has bounced back from its March low of 1.2999, crossing above its 50-period simple moving average (SMA) as positive momentum resurfaced. However, the pair is currently trading well below its 200-period SMA and hasn’t yet broken its series of successive lower lows, reinforcing an overall bearish outlook. Short-term momentum oscillators reflect a positive bias as the RSI is located above its 50 neutral mark. Also, the MACD is found above zero and its red signal line, which indicates that [..]

Technical Analysis – USDCAD slips near 200-day SMA and uptrend line at 1.2600

Posted on March 18, 2022 at 7:46 am GMT

USDCAD is currently challenging the long-term ascending trend line and the 200-day simple moving average (SMA) around the 1.2600 psychological mark. The price is showing some signs that it would be a penetration of the diagonal line, suggesting the start of a neutral outlook. According to the technical indicators, the MACD oscillator dived beneath its zero line, strengthening its momentum below trigger line, while the RSI is falling below the neutral threshold of 50. The 20- and 40-day SMAs are [..]

post-image

Technical Analysis – BTCUSD sets up for next round of volatility

Posted on March 17, 2022 at 4:31 pm GMT

BTCUSD (Bitcoin) has been following a neutral trajectory since the end of January, driving back and forth between the 45,855 and 32,950 boundaries, though a symmetrical triangle started to become evident in March, suggesting that the next round of volatility could soon commence. The momentum indicators provide little clue about which direction the market will take as the RSI keeps fluctuating around its 50 neutral mark, and the MACD is stable just below zero. Yet as long as the former [..]

post-image

Technical Analysis – AUDJPY faces downside risks but the outlook remains bullish

Posted on March 17, 2022 at 11:33 am GMT

AUDJPY has powered up over the past month reaching multi-year highs as positive momentum mounts. Moreover, the pair is currently trading above its 50- and 200-day simple moving averages (SMAs), which together with the series of successive higher lows reinforce its overall bullish outlook. Short-term momentum oscillators reflect a mixed picture as the RSI is found above its 70 overbought region, signaling that an imminent pullback is not out of the equation. However, the MACD is found above zero and [..]

Technical Analysis – WTI oil futures set a floor, but is it stable?

Posted on March 17, 2022 at 9:32 am GMT

WTI oil futures (April delivery) started the day on a positive note on Thursday after two weeks of harsh selling. The positive momentum in the price is following the formation of a bullish doji around 95.32, which seems to have set the ground for an upside reversal along with the ascending trendline drawn from December’s low of 62.25. That said, the short-term bias has not switched to the bullish side yet, according to the momentum indicators. The RSI has slipped below its 50 neutral [..]

Risk Warning: Your capital is at risk. Leveraged products may not be suitable for everyone. Please consider our Risk Disclosure.