XM does not provide services to residents of the United States of America.

Technical Analysis

Technical Analysis – USDJPY unlocks fresh 6-year high; bullish but overbought

Posted on March 23, 2022 at 8:15 am GMT

USDJPY stretched Tuesday’s exponential rally to a fresh 6-year high of 121.40 on Wednesday, boosting its gains by 5.2% so far in March. The market structure is strongly bullish, underpinned by the upward sloping simple moving averages (SMAs). Yet, with the price trading way above its SMAs and the RSI approaching its 2016 high after deviating significantly above its 70 overbought level, there is growing speculation that the bulls could soon run out of fuel. The Stochastics are in line with this [..]
post-image

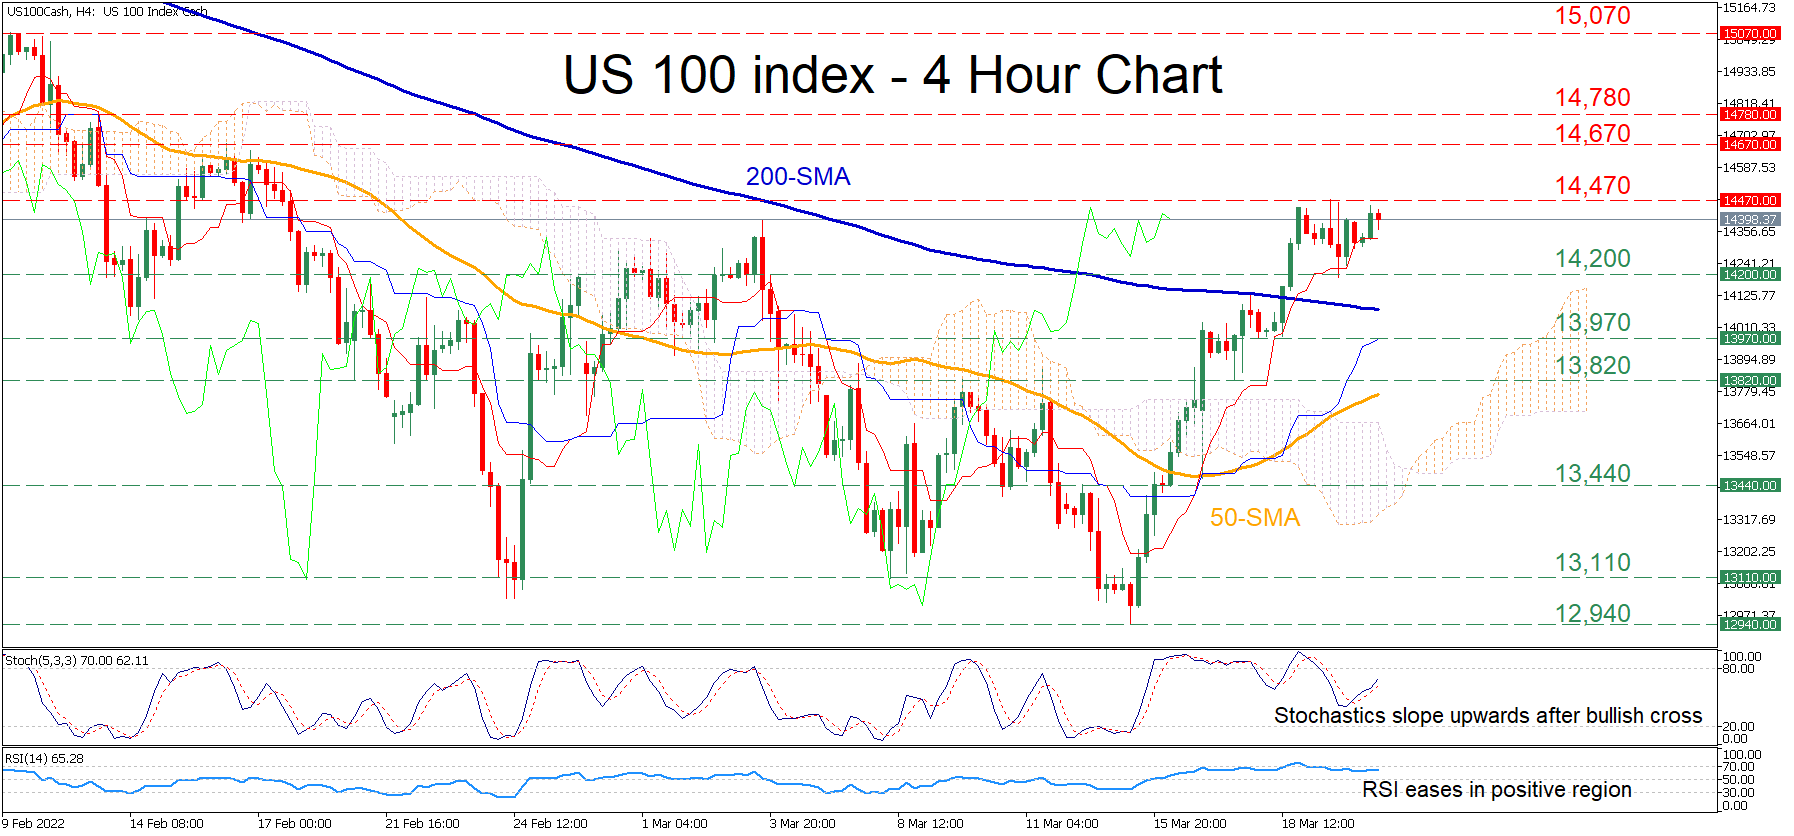
Technical Analysis – US 100 index rangebound after upside move stalls

Posted on March 22, 2022 at 2:21 pm GMT

The US 100 stock index (cash) has been recovering on the four-hour chart, managing to erase some of its recent decline. Although the price has been moving sideways in the last few sessions, the ascending 50-period simple moving average (SMA) is closing the gap with the 200-period SMA, where a potential crossover could reinforce the case of a sustained uptrend. The momentum indicators suggest that bullish forces remain active. The stochastic oscillator is marching higher after posting a bullish cross, while the [..]

post-image

Technical Analysis – JP 225 index storms higher amid lingering positive forces

Posted on March 22, 2022 at 11:28 am GMT

JP 225 stock index (cash) has been edging higher in the short term after its long-term downtrend ceased at the 16-month low of 24,500. However, the price has just entered the Ichimoku cloud, indicating that the road to a complete recovery remains long. The momentum indicators endorse a bullish immediate-term bias. The RSI is hovering above its 50-neutral mark, while the MACD histogram is found beyond its red signal line but in the negative zone. Should buying interest intensify further, the recent high [..]

post-image

Technical Analysis – EURJPY boosts bullish bias with push beyond 132 mark

Posted on March 22, 2022 at 10:25 am GMT

EURJPY has powered past the 131.90 mid-February high, a barrier which previously managed to pause the two-week aggressive rally that launched from a 15-month low of 124.38. The mostly horizontal simple moving averages (SMAs) continue to mirror the relatively neutral trend, which has governed the pair over the last six-months or so. The short-term oscillators suggest sturdy positive momentum is intact. The MACD is strengthening far above the zero threshold and its red trigger line, while the RSI is eyeing [..]

Technical Analysis – GBPUSD pulls below 1.3200; bearish but not too bearish

Posted on March 22, 2022 at 8:35 am GMT

GBPUSD came under fresh selling pressures after its rebound off 1.3000 touched the 20-day simple moving average (SMA) and the 1.3200 round level, with the price decelerating to an intra-day low of 1.3119 on Tuesday. The pair is also struggling to preserve strength above the 23.6% Fibonacci retracement of the 1.1409 – 1.4248 up leg at 1.3163. The fast Stochastics have pivoted southwards near their 80 overbought level, reflecting fading buying interest. However, with the RSI maintaining its upward trajectory within the [..]

post-image

Technical Analysis – Apple’s stock advance pauses at 50-SMA; bias bullish

Posted on March 22, 2022 at 8:33 am GMT

Apple’s stock has been in a descending move since early January, when the price peaked at its all-time high of 182.75. However, in the last few daily sessions, the stock has been recouping part of its losses after finding its feet at the 150.00 region. The short-term oscillators suggest a cautiously bullish immediate-term bias. The MACD histogram has crossed above its red signal line but remains in the negative territory, while the RSI is currently above its 50-neutral threshold. Should [..]

post-image

Technical Analysis – US 500 index’s gains hit fortified resistance wall

Posted on March 21, 2022 at 9:57 am GMT

The US 500 stock index (Cash) is struggling to overcome the 200-day simple moving average (SMA), coupled with the Ichimoku cloud in the 4,500 price vicinity after finding significant positive traction within the 4,106-4,155 support section. The falling 50- and 100-day SMAs are sponsoring the bearish bias from the beginning of the year. Currently, the Ichimoku lines are not indicating any clear driving forces in the index, while the short-term oscillators are transmitting mixed signals in directional momentum. The MACD [..]

post-image

Technical Analysis – EURCHF’s pullback halts at 50-SMA; bias cautiously negative

Posted on March 21, 2022 at 9:34 am GMT

EURCHF has been marching higher since the beginning of March generating a clear structure of higher highs and higher lows. However, in the last few four-hour sessions, the pair has been losing ground after encountering strong resistance at the 1.0400 region. The short-term oscillators suggest that bearish forces have gained the upper hand. The MACD histogram is currently below its red signal line in the positive region, while the RSI is ticking downwards beneath its 50-neutral threshold. Nevertheless, the price [..]

Technical Analysis – EURUSD faces fading bearish bias, but confirmation required

Posted on March 21, 2022 at 9:23 am GMT

EURUSD opened the week silently, hovering near Friday’s closing price and around the 20-day simple moving average (SMA) at 1.1046. The 1.1120 – 1.1180 territory, which has been a key constraint to upside and downside movements since the end of November, remains the main target following the bounce off 1.0805. Interestingly, the 61.8% Fibonacci retracement of the  1.0636 – 1.2348 upleg is placed within this zone, while the 50-day SMA is approaching that area too, making any violation here important to watch. Should [..]

Technical Analysis – Gold struggles to extend declines after hitting a floor at 1,920

Posted on March 21, 2022 at 7:34 am GMT

Gold prices are continuing last week’s move around the key level of 1,920, which is the 38.2% Fibonacci retracement level of the up leg from 1.680 to 2,070.40 and at the same time is confirming the pullback from the 1,950 resistance and the 20-day simple moving average (SMA). The short-term bias looks negative as the MACD keeps losing ground below its red signal line, while the RSI seems to be making its way near its 50-neutral mark, though a further decline is needed from both [..]

Risk Warning: Your capital is at risk. Leveraged products may not be suitable for everyone. Please consider our Risk Disclosure.