XM does not provide services to residents of the United States of America.

Technical Analysis

post-image

Technical Analysis – AMD stock gains traction but outlook remains negative
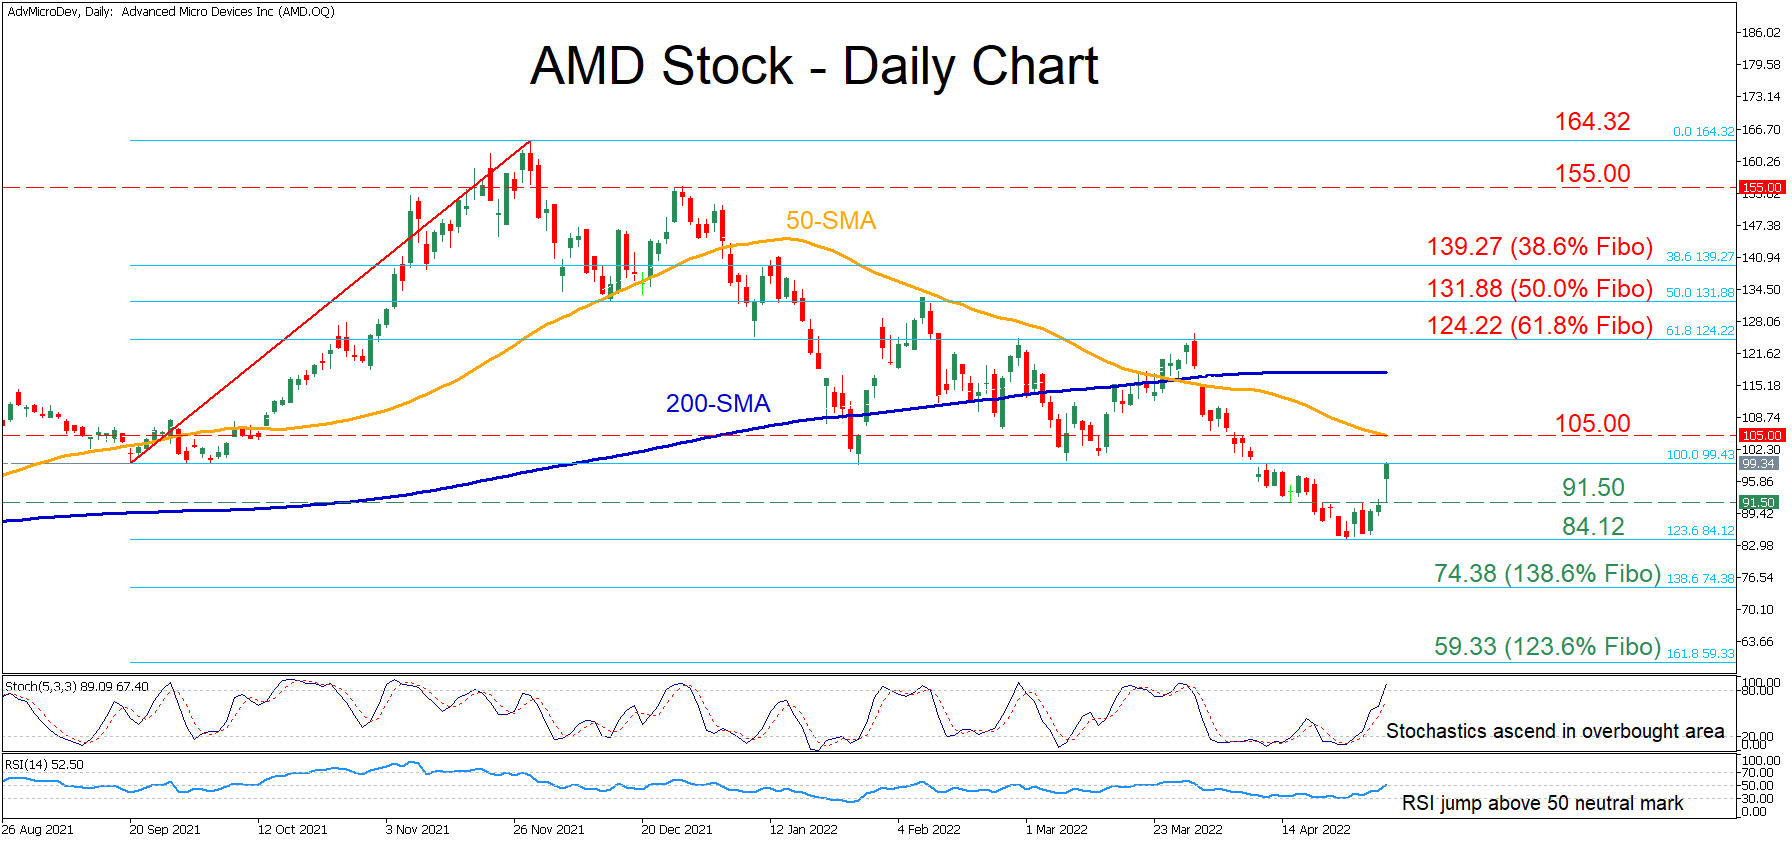
Posted on May 5, 2022 at 9:09 am GMT

AMD’s stock has been trending downwards after peaking at the all-time high of 164.32 in November. However, in the last couple of daily sessions, the price found its feet and is currently trying to push higher. The momentum indicators confirm that buying interest has intensified. The stochastic oscillator is sloping upwards in the overbought area, while the RSI has crossed above its 50-neutral mark. In the bullish scenario, the price could ascend towards its 50-day simple moving average (SMA), currently [..]

post-image

Technical Analysis – Twitter stock consolidates after advance pauses

Posted on May 5, 2022 at 7:49 am GMT

Twitter’s stock experienced a sharp jump in the beginning of April when the potential acquisition from Elon Musk was announced. However, after this initial boost, the positive momentum has failed to strengthen further, and the price has been trading sideways. The momentum indicators suggest that bullish forces have gained the upper hand. The stochastic oscillator is marching higher after posting a bullish crossover, while the RSI is flatlining above its 50-neutral threshold. Moreover, the price is trading above the Ichimoku cloud, [..]

Technical Analysis – GBPUSD retraces FOMC bounce, but will the bulls give up?

Posted on May 5, 2022 at 7:34 am GMT

GBPUSD closed confidently above the 1.2570 resistance area on Wednesday after a short period of consolidation, raising hopes that the bounce off 1.2410 may get new legs in the short term ahead of today’s BoE policy announcement (12:00 GMT). The pair is currently giving up some ground, but the positive trajectory in the RSI and the Stochastics, which have recently exited the oversold territory, and the gradual recovery in the MACD, are sending encouraging signals that buying appetite could soon return. [..]

Technical Analysis – WTI futures struggle to surpass 109.20 level

Posted on May 5, 2022 at 7:29 am GMT

WTI crude oil futures are flirting with the 109.20 resistance, which failed several times in the previous weeks to surpass it. More increases could add some optimism to the bulls for a positive outlook in the short-term and long-term. The technical indicators are also suggesting a bullish momentum. The RSI is pointing up above the neutral threshold of 50, while the MACD is stretching above its trigger line and zero lines. On the upside, the price could attempt to overcome [..]

post-image

Technical Analysis – Gold’s bearish bias calmed by support boundary

Posted on May 4, 2022 at 2:54 pm GMT

Gold is tiptoeing across the flattened red Tenkan-sen line at 1,864 after the more than two-week decline from the 2,000 price vicinity bounced off a support zone that stretches back to mid-February. The descending slopes of the simple moving averages (SMAs) are endorsing the recent downward trajectory in the commodity. Currently, the Ichimoku lines are indicating a pause in the downward driving forces, while the short-term oscillators are exhibiting weak negative momentum. The MACD, in the bearish region, is holding [..]

Technical Analysis – USDJPY indecisive ahead of FOMC policy decision

Posted on May 4, 2022 at 2:19 pm GMT

USDJPY has barely been moving so far this week ahead of the FOMC policy announcement, facing strong rejection around the 130.20 barrier. Although the pair remains close to its recent 20-year top of 131.24, the possibility for a downside correction is technically growing larger as the RSI and the MACD trend southwards, with the former set to exit the overbought territory and the latter gradually sliding below its red signal line. Nevertheless, how meaningful any pullback could be is still a [..]

post-image

Technical Analysis – EURGBP portrays feeble bullish tone, broader bias neutral

Posted on May 4, 2022 at 9:42 am GMT

EURGBP is trading between the supporting mid-Bollinger band and its capping upper Bollinger band, struggling to sustain its upside vibe north of its rising 50-period simple moving average (SMA). The 200-period SMA, which has stabilized for some time now, continues to sponsor a horizontal trajectory in the pair, while the bullish 50- and 100-period SMAs are endorsing upward price action, aimed at the upper regions of a trading range that started from the beginning of the year. The range has [..]

Technical Analysis – Will NZDUSD confirm a bullish star doji pattern?

Posted on May 4, 2022 at 7:23 am GMT

NZDUSD is creating a bullish star doji on Tuesday after it dropped to a new 22-month low of 0.6410 and if the price heads higher, it could confirm a positive move in the short-term timeframe. However, the technical indicators are still suggesting a negative bias. The MACD oscillator is still strengthening its bearish move below its trigger and zero lines, while the RSI is standing in the oversold territory and is sloping down. Should prices decline, immediate support could be [..]

post-image

Technical Analysis – AUDUSD around 0.7100 mark but bearish risks linger

Posted on May 3, 2022 at 9:47 am GMT

AUDUSD has snagged around the 0.7100 handle, trading in between the Ichimoku lines, after the pair’s fresh bounce in the vicinity of three-month lows at 0.7029. The pair is finding difficulty to reach yesterday’s intraday high of 0.7147 despite the Reserve Bank of Australia’s larger interest rate hike earlier today, which kept the pair bid in the Asian session. That said, the bearish simple moving averages (SMAs) are endorsing the negative trajectory in the pair. Currently, the Ichimoku lines indicate [..]

Technical Analysis – Will EURUSD resume its bearish pattern?

Posted on May 3, 2022 at 9:00 am GMT

EURUSD switched to consolidation following the dip to a 5 ½-year low of 1.0470 last week, ranging quietly between the 1.0550 resistance and the 1.0497 support for the fourth consecutive day. The RSI and the Stochastics are making efforts to exit the oversold territory, though they need more convincing upside moves to signal the end of April’s sell-off, especially as the MACD remains negatively charged after crossing below a key base. In terms of the market trend, the downward-sloping simple moving averages (SMAs) are [..]

Risk Warning: Your capital is at risk. Leveraged products may not be suitable for everyone. Please consider our Risk Disclosure.