XM does not provide services to residents of the United States of America.

Technical Analysis

Technical Analysis – AUDUSD ticks down below 0.6900; next support at 2-year low

Posted on June 23, 2022 at 7:21 am GMT

AUDUSD has been underperforming over the last week as it failed to surpass the short-term simple moving averages (SMAs). The price is currently diving beneath the 0.6900 round number, and it appears ready to retest the almost two-year low of 0.6827. Even lower, the market may find strong support near the 0.6770 level, taken from the low in June 2020. Breaking these obstacles, traders may take the pair until the April 2020 inside swing high at 0.6570, confirming the long-term [..]
post-image

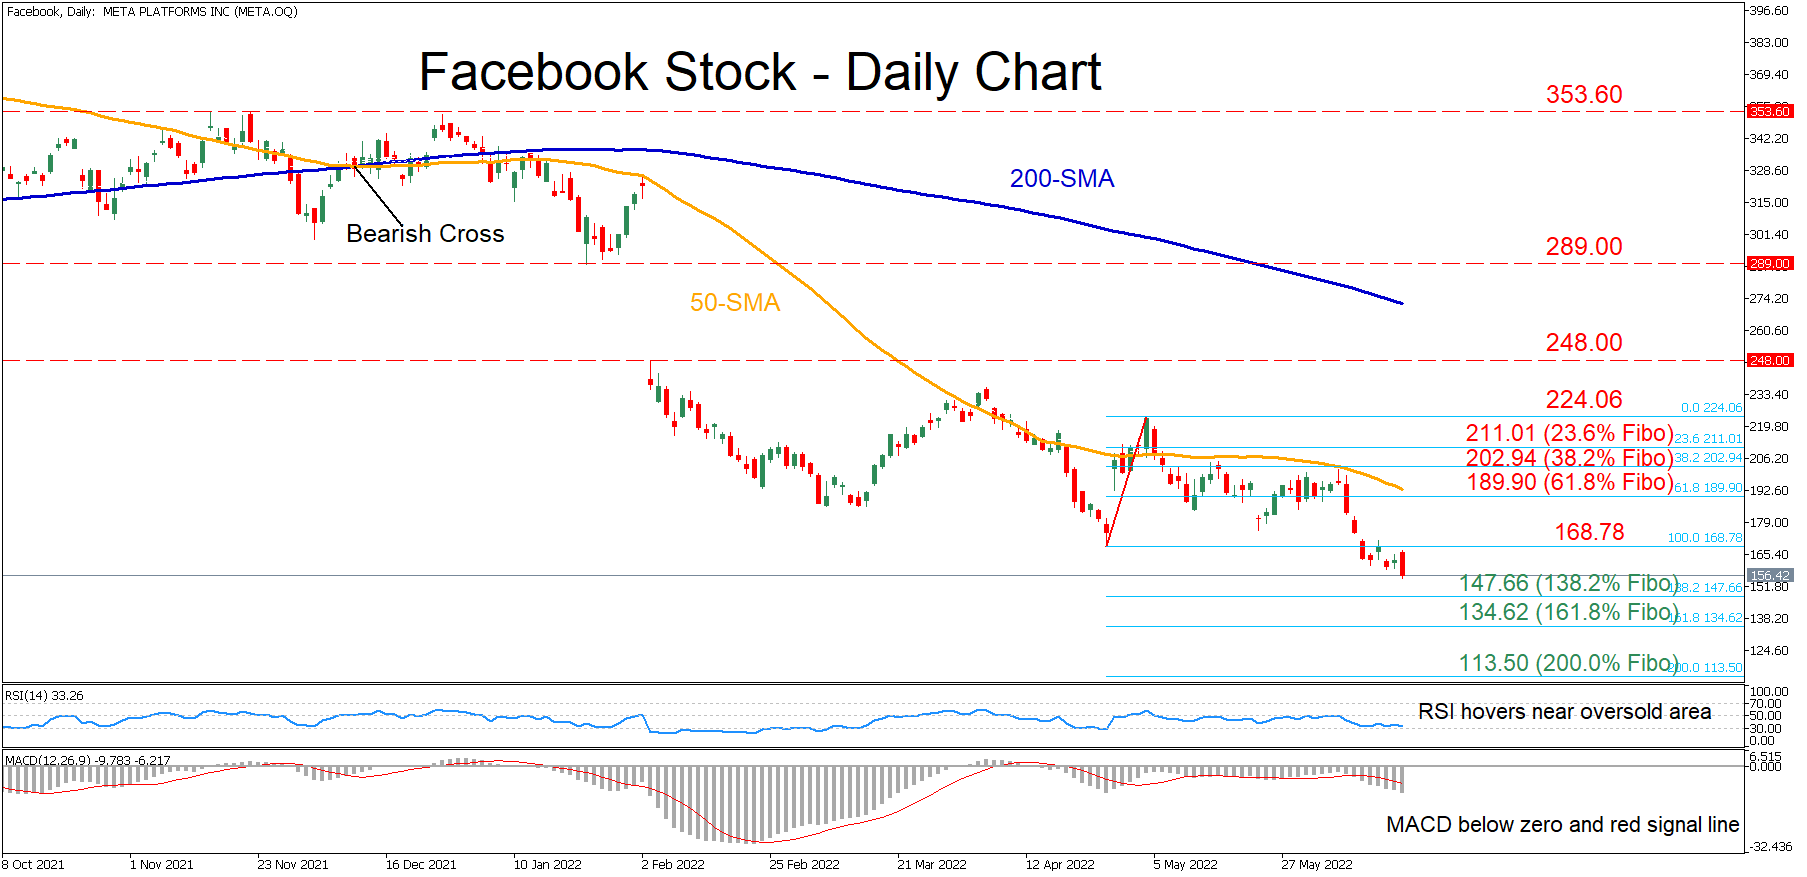
Technical Analysis – Facebook stock extends decline amid intensifying negative momentum

Posted on June 22, 2022 at 9:58 am GMT

Facebook’s stock has been inching lower in the long term, creating a profound structure of lower highs and lower lows. Additionally, the price is currently trading below the descending 50- and 200-day simple moving averages (SMAs), endorsing a broader negative short-term picture. The momentum indicators are depicting a bearish near-term bias. Specifically, the RSI is flatlining near the 30-oversold area, while the MACD histogram has dived beneath both zero and its red signal line. Should the negative momentum intensify, the price could descend towards [..]

post-image

Technical Analysis – JP 225 index maintains cloudy outlook

Posted on June 22, 2022 at 9:22 am GMT

Japan’s 225 stock index (cash) got rejected near the 50% Fibonacci retracement of the 24,500 – 28,649 upleg at 26,576 soon after departing from May’s base of 25,508. The bearish bias is still in play as the RSI is retracing its latest rebound below its 50 neutral mark, while the MACD keeps extending its negative momentum below its red signal line. If the 61.8% Fibonacci of 25,820 gives way on the downside, the bears will push harder to escape the trap around 25,508 and [..]

post-image

Technical Analysis – EURGBP shows improvement near 0.8600

Posted on June 22, 2022 at 9:22 am GMT

EURGBP is looking bullish in the short term after surging near its upper Bollinger band and the technical indicators are all pointing to further positive momentum in the near term. The stochastics are heading upwards, with the %K and %D lines posting a bullish crossover, suggesting plenty of scope for additional upside moves. The RSI remains in bullish territory but has yet to approach the 70 overbought level. Immediate resistance to further gains would likely come from the upper Bollinger [..]

post-image

Technical Analysis – Gold marks lower lows as decline accelerates

Posted on June 22, 2022 at 7:51 am GMT

Gold has been in a sustained downtrend after it failed to cross beyond the 1,857 region. Moreover, in the past few four-hour sessions, the price has dived beneath both 50- and 200-period simple moving averages (SMAs) alongside its lower Bollinger band, painting a doomy short-term technical picture for bullion. The momentum indicators are endorsing a bearish near-term bias. Specifically, the stochastic oscillator is descending in the oversold zone, while the MACD histogram is currently below both zero and its red [..]

Technical Analysis – USDJPY slips slightly below the new 24-year peak

Posted on June 22, 2022 at 7:28 am GMT

USDJPY is holding around the fresh 24-year high at 136.70, surpassing successfully the previous highs of 135.57 and endorsing the bullish view. The MACD is moving further above its red signal line, and the RSI is pointing down after it reached the 70 level. However, the latter could also be an indication that the advance has been exaggerated, and as a result, bearish corrections in the upcoming sessions should not come as a surprise to investors. In the event that [..]

Technical Analysis – NZDUSD eyes June’s lows as bears regain control

Posted on June 22, 2022 at 7:28 am GMT

NZDUSD resumed its slide on Wednesday, bringing the key 0.6335 – 0.6195 bottom area back under the spotlight after a four-day-long unsuccessful battle with the red Tenkan-sen line. The RSI and the MACD remain negatively charged within the bearish zone, while the negative intersection between the red Tenkan-sen and blue Kijun-sen lines is another indication that the bears may hold onto control in the coming sessions. Should the price close below 0.6235, the former resistance zone around 0.6160 may immediately attract some [..]

post-image

Technical Analysis – AUDUSD moves back and forth from 23.6% Fibonacci

Posted on June 21, 2022 at 1:30 pm GMT

AUDUSD is moving back and forth from the 23.6% Fibonacci retracement level of the down leg from 0.7280 to 0.6850 at 0.6950. The short-term bias looks neutral-to-negative as the RSI keeps losing ground below the 50 level, while the stochastic oscillator posted a bearish crossover within its %K and %D lines. If the pair continues moving to the downside, investors could find immediate support at the 0.6895 barrier ahead of the 0.6850 barrier, which is a 13-month low. More decreases may extend the [..]

post-image

Technical Analysis – US 100 index pulls back from 19-month low

Posted on June 21, 2022 at 9:43 am GMT

The US 100 cash index has rebounded somewhat after falling to a 19-month low of 11,035 on June 16 but the MACD indicator now suggests that the market sentiment might get worse before getting better as it is reversing back to the downside after failing to break decisively above its trigger line. However, the RSI looks to be changing direction, moving up to meet its neutral threshold of 50. Should bearish dynamics dominate, the market might revisit the 19-month trough of 11,035 before meeting [..]

Technical Analysis – EURJPY pushes above 142.00; bias cautiously bullish

Posted on June 21, 2022 at 7:35 am GMT

EURJPY is still eagerly pushing for a close above the 142.00 psychological mark, which came to oppose Friday’s quick bounce on the 20-day simple moving average (SMA) and the 139.40 level. The ascending simple moving averages are endorsing the positive trend in the market, while the rebound in the RSI, which is trying to print a new higher high above its 50 neutral mark, is an encouraging sign that buyers are still in play. The upward trajectory in the Stochastics is [..]

Risk Warning: Your capital is at risk. Leveraged products may not be suitable for everyone. Please consider our Risk Disclosure.