XM does not provide services to residents of the United States of America.

Technical Analysis

post-image

Technical Analysis – EURJPY bullish correction still at risk

Posted on August 9, 2022 at 7:21 am GMT

EURJPY has been in the green every single day since the plunge to an almost three-month low of 133.39 and the creation of a bullish hammer candlestick last week, rising gradually up to 137.91 on Monday. The short bullish sequence, however, has not shifted the bias clearly on the positive side yet, as the RSI remains below its 50 neutral mark and the MACD is still trying to overcome its red signal line in the negative area. The 20-day simple [..]

post-image

Technical Analysis – GBPUSD capped by 50-day SMA as rebound falters

Posted on August 9, 2022 at 6:52 am GMT

GBPUSD has been in a prolonged downtrend since the beginning of the year, creating a clear structure of lower highs and lower lows. Although the pair managed to faintly bounce back after its downfall halted at the 28-month low of 1.1760, the price has been repeatedly held down by the 50-day simple moving average (SMA) in the last few daily sessions. The momentum indicators reflect a cautiously negative tone. Specifically, the stochastic oscillator is descending near its 20-oversold area, while the RSI [..]

post-image

Technical Analysis – USDJPY remains supported after post-NFP bounce

Posted on August 8, 2022 at 10:25 am GMT

USDJPY jumped on the back of a stronger-than-expected US nonfarm payrolls report on Friday, piercing aggressively the constraining 50-period simple moving average (SMA) on the four-hour chart to top at 135.57. From a technical perspective, optimism is still intact as the quick ascent has sent the price slightly above the Ichimoku cloud, while the RSI and the MACD have also bounced back into the bullish area. That said, some caution is warranted given the negative slope in the stochastics, as [..]

post-image

Technical Analysis – US 500 index defends bullish direction; bias cautiously positive

Posted on August 8, 2022 at 9:02 am GMT

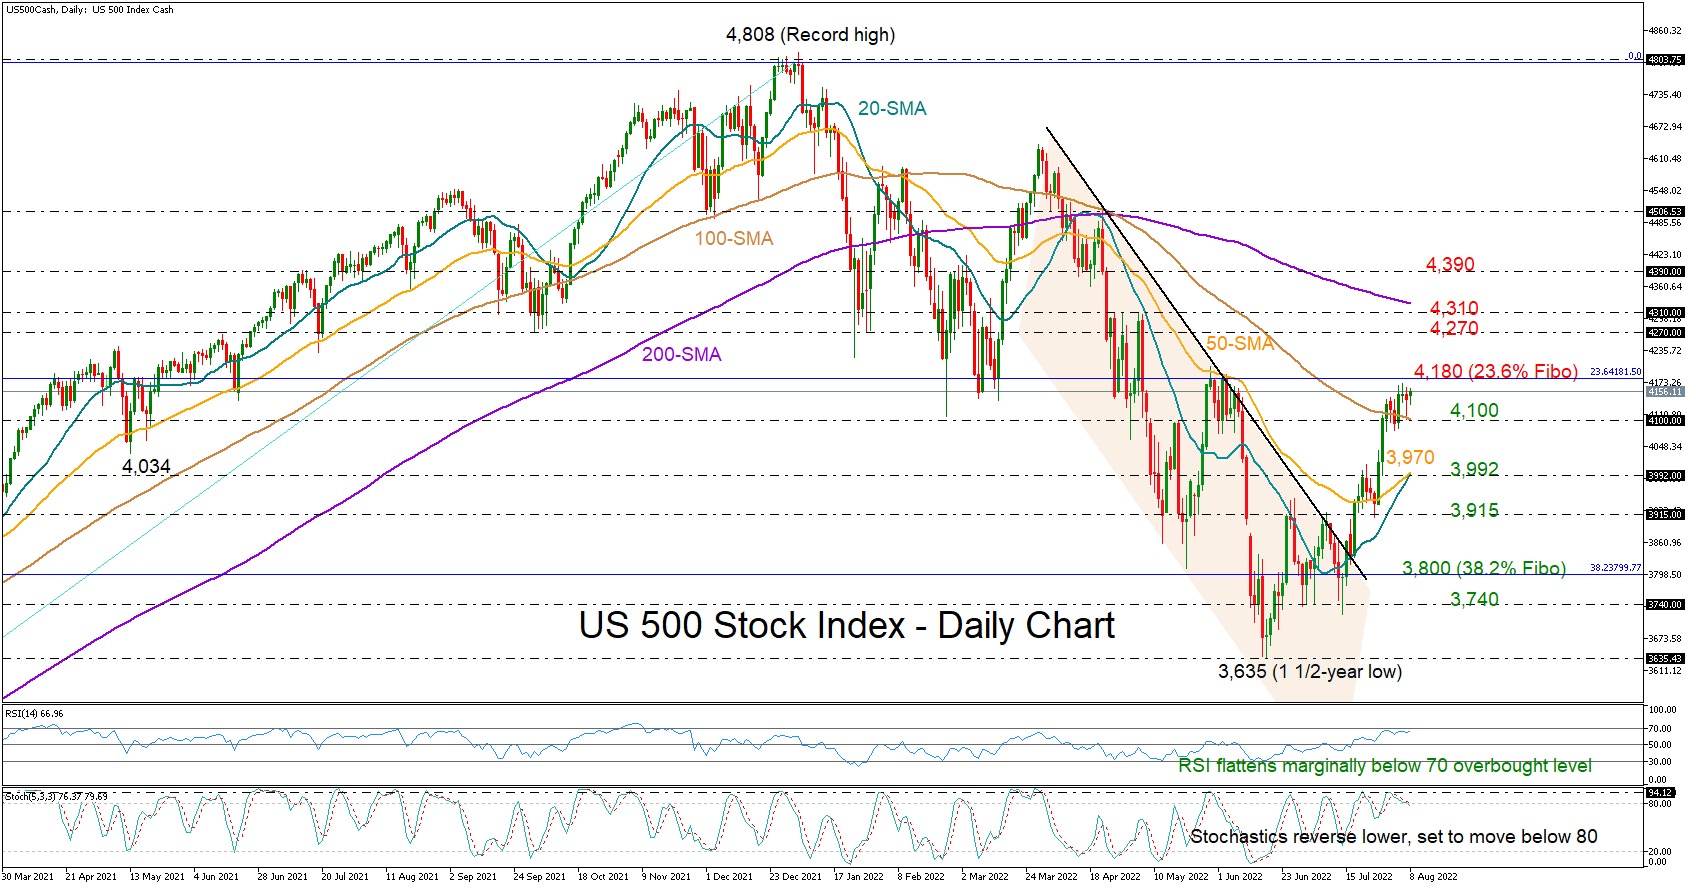
The US 500 stock index (cash) managed to crawl above its 100-day simple moving average (SMA) last week and rise as high as 4,170, adding more credence to the short-term bullish trend. Although the price is marginally below the previous high, a successful break of which is needed to violate the medium-term downtrend, the momentum indicators have started to flash overbought signals. The RSI is flattening marginally below 70, while the stochastics have already reversed south and are set to cross below [..]

post-image

Technical Analysis – EURUSD continues to trade within tight boundaries

Posted on August 8, 2022 at 8:04 am GMT

EURUSD has been trading sideways for three weeks after the price managed to rebound from the 20-year low of 0.9951. In addition, the pair is currently standing below both its descending 50- and 200-day simple moving average (SMAs), endorsing a broader bearish technical picture. The momentum indicators suggest that near-term risks are tilted to the downside. Specifically, the MACD histogram remains in the negative territory but above its red signal line, while the RSI is flatlining beneath its 50-neutral mark. Should [..]

post-image

Technical Analysis – Gold stays within bearish channel

Posted on August 8, 2022 at 7:29 am GMT

Gold was trading with a muted tone during Monday’s early European trading hours at $1,774 following the pullback near the 50-day simple moving (SMA) and the surface of the downward-sloping channel last Friday. The latest decline raised concerns about whether a new downturn will start within the bearish channel, but the momentum indicators have yet to clarify this. Although losing steam, the RSI is still above its 50 neutral mark, while the MACD remains attached around zero and marginally above its red signal [..]

post-image

Technical Analysis – Silver prints bullish pennant pattern

Posted on August 5, 2022 at 12:14 pm GMT

Silver has been on the sidelines since its quick bounce at the end of July topped at an almost two-month high of 20.49. The range area looks to be transforming now to a bullish pennant structure, which technically is considered a continuation trend pattern. The progressing golden cross between the 50- and 200-period simple moving averages (SMAs) on the four-chart is also raising hopes that the latest upside correction could soon resume. In contrast, the momentum indicators suggest that some [..]

Technical Analysis – GBPJPY tests support trendline; bias bearish

Posted on August 5, 2022 at 9:25 am GMT

GBPJPY pulled back to test the support trendline at 161.00, which connects the lows from spring, after a failed attempt to pierce its 20- and 50-day simple moving averages (SMAs) around 164.00 on Thursday. From a technical perspective, sellers seem to have the upper hand as the MACD keeps decelerating within the negative zone and the RSI is reversing southwards, putting in some distance below its 50 neutral mark. If the bears finally achieve a close below the ascending trendline, the 159.86 area, which [..]

Technical Analysis – USDCAD holding steady ahead of jobs data

Posted on August 5, 2022 at 7:36 am GMT

USDCAD shifted to the sidelines immediately after charting a new lower low at 1.2766 in the short-term picture, unable to reach the constraining 20-day simple moving average (SMA). The technical indicators state a bearish-to-neutral bias as the RSI keeps flattening marginally below its 50 neutral mark and the MACD is extending its short horizontal move slightly below zero around its red signal line. Hence, traders may keep directing the market sideways unless they see a break above the 20-day SMA [..]

post-image

Technical Analysis – Apple stock looking a little overstretched after recent gains

Posted on August 4, 2022 at 3:07 pm GMT

Apple stock has successfully cleared the 61.8% Fibonacci retracement of the downtrend from the all-time high of 182.74 reached in January to the one-year low of 128.92 plumbed in June. Having surpassed the 61.8% Fibonacci of 162.18, the next key resistance level might not arrive until the 78.6% Fibonacci of 171.22. Beyond that level, only the late March peak of 179.46 would be the only thing standing in the way of the price hitting its record high of 182.74. Looking [..]

Risk Warning: Your capital is at risk. Leveraged products may not be suitable for everyone. Please consider our Risk Disclosure.