XM does not provide services to residents of the United States of America.

Technical Analysis

post-image

Technical Analysis – EURCHF approaches SNB flash crash low

Posted on August 11, 2022 at 9:35 am GMT

EURCHF entered a sliding mode this week, after hitting 0.9800, and is now hovering near the July 29 low, at 0.9700. Overall, the pair has been trading in a downtrend, staying below all three of the plotted moving averages, since mid-June. The likelihood for further declines is enhanced by both the RSI and the MACD. The former has turned back down and is now approaching 30 again, while the latter remains well within its negative territory. That said, it lies above [..]

post-image

Technical Analysis – AUDUSD spikes after soft US CPI print

Posted on August 11, 2022 at 8:22 am GMT

AUDUSD had been battling with its 50-day simple moving average (SMA) after it rebounded from the 26-month low of 0.6680. However, in the previous session the pair experienced a huge jump, closing decisively above its 50-day SMA and coming to a halt at the upper Bollinger band. The short-term oscillators are reflecting the intensifying positive momentum. Specifically, the MACD histogram has jumped above zero and its red signal line, while the RSI is flatlining above its 50-neutral threshold. Should buying [..]

post-image

Technical Analysis – Gold abandons bullish channel, but confirmation required

Posted on August 11, 2022 at 8:15 am GMT

Gold could not sustain its bullish power above the 1,795 ceiling despite its flash spike to 1,807 on Wednesday, with the price retreating below the upward-sloping channel instead to reach a low of 1,783 early on Thursday. While the negative breakout has raised the odds for more downside, the precious metal might have another opportunity to find its feet near the surface of the March bearish channel at 1,785, while the 50-period simple moving average (SMA) on the four-hour chart, currently aligned [..]

post-image

Technical Analysis – WTI oil futures gently move up; key resistance ahead

Posted on August 11, 2022 at 6:59 am GMT

WTI oil futures (August delivery) have been gently crawling up over the past week following the close below the 200-day simple moving average (SMA) and the drop to a six-month low of $87.00/barrel. The price is currently looking to return above the $92.19 constraining zone, which was the lower boundary of the previous range area, but this will not be enough to boost buying confidence. The bulls will also need to climb above the 20- and 200-day SMAs, which are trying to [..]

post-image

Technical Analysis – Tesla stock loses ground after rebound falters

Posted on August 10, 2022 at 2:05 pm GMT

Tesla’s stock has been in a sustained uptrend since early June, generating a structure of higher highs and higher lows. However, in the past few sessions, the recovery seems to be stalling after news emerged that Elon Musk sold 7.92 million shares during the past week. The momentum indicators reflect this loss of positive momentum for the stock. Specifically, the stochastic oscillator has dropped in the 20-oversold zone, while the MACD histogram has dived beneath its red signal line but [..]

post-image

Technical Analysis – EURGBP pauses bullish wave; 20-SMA in focus

Posted on August 10, 2022 at 8:22 am GMT

EURGBP shifted to the sidelines in the four-hour chart after hitting resistance around the 50% Fibonacci retracement of the 0.8583 – 0.8338 downleg at 0.8460 on Tuesday. The weakness in the RSI and the MACD is backing some stabilization in the short term, though the former is still some distance above its 50 neutral mark, while the latter is attached to its red signal line. Therefore, there might be another opportunity for a rebound before the bears take control, especially [..]

post-image

Τechnical Analysis – USDJPY resumes rebound but 50-day SMA caps advance

Posted on August 10, 2022 at 8:05 am GMT

USDJPY has been gaining some ground in the short-term after its latest decline came to a halt at the 130.40 region. However, the recent price recovery has been repeatedly held down by the ascending 50-day simple moving average (SMA). The momentum indicators suggest that near-term risks are tilted to the upside. Specifically, the stochastic oscillator is flatlining in its 80-overbought area, while the MACD histogram has jumped above its red signal line but remains in negative territory. Should positive momentum strengthen [..]

post-image

Technical Analysis – NZDUSD in quiet trading ahead of US CPI inflation

Posted on August 10, 2022 at 7:20 am GMT

NZDUSD has been silent since Monday’s negligible pickup, which put the market in the green territory on a weekly basis, trading flat at 0.6280 ahead of the US CPI inflation early on Wednesday. The pair is currently trying to build a floor around the 50-day simple moving average (SMA) at 0.6274 following the bounce on the 20-day SMA and the lower boundary of the short-term bullish channel on Monday, but the technical oscillators are barely promoting any meaningful rebound at the [..]

post-image

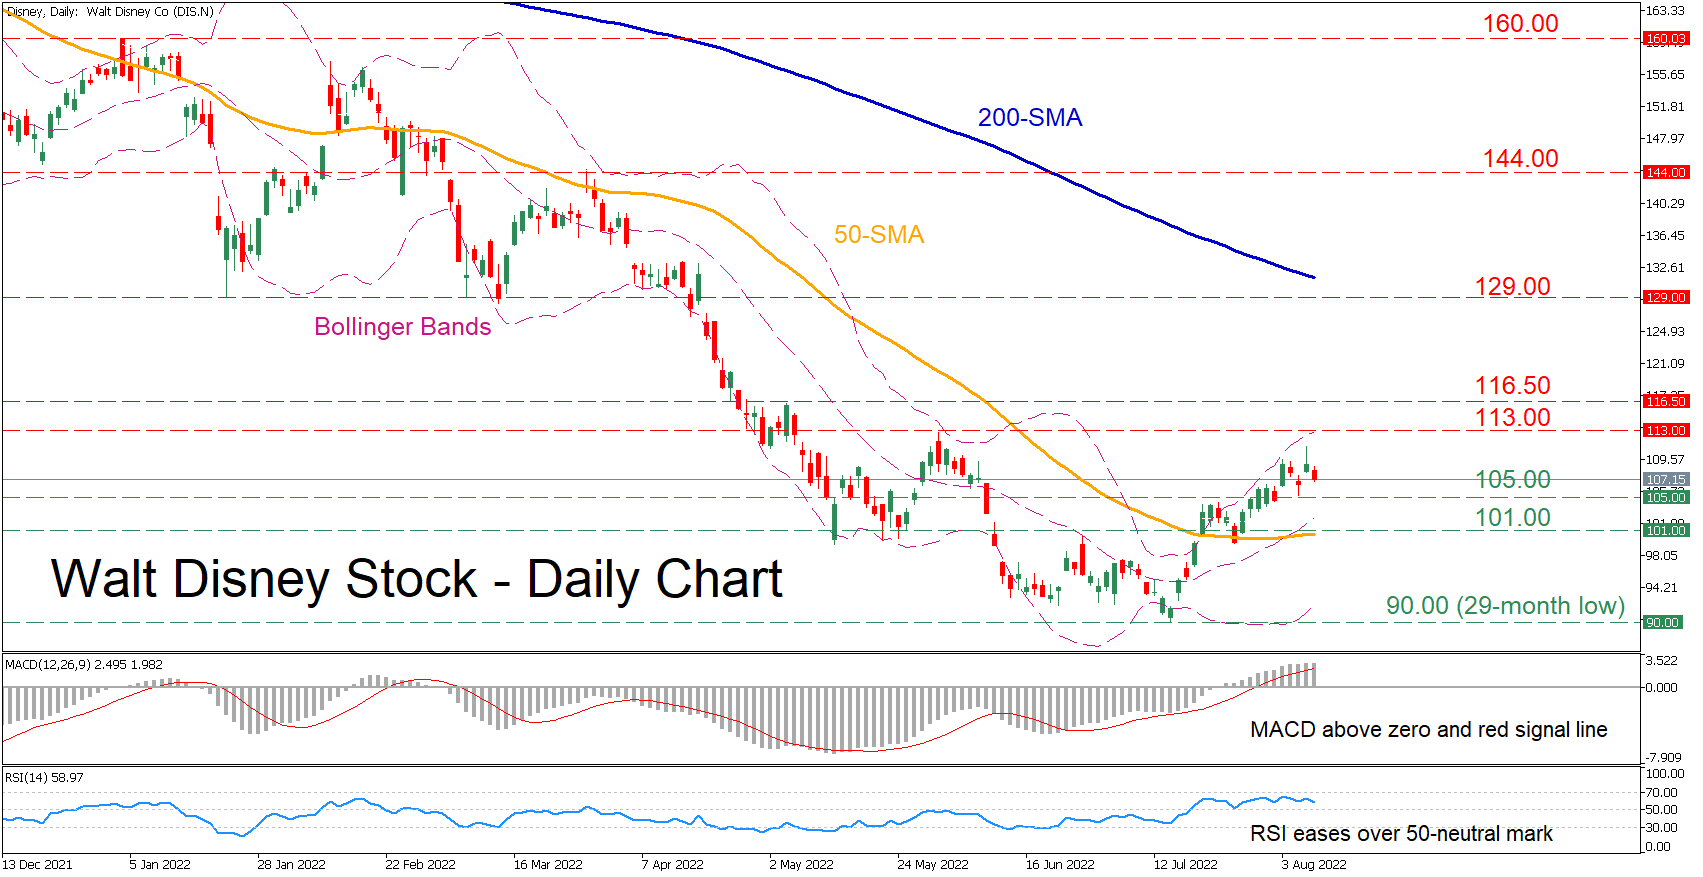
Technical Analysis – Disney stock bounces off 29-month low

Posted on August 9, 2022 at 2:23 pm GMT

Disney’s share price has been in a sustained downtrend since the beginning of the year, but lately it is exhibiting some signs of a recovery after rebounding from the 29-month low of 90.00. Hence, the upcoming earnings release on Wednesday could potentially enable the stock to extend its recent upside impetus. The short-term oscillators suggest that near-term risks are tilted to the upside. Specifically, the MACD histogram is currently above both zero and its red signal line, while the RSI is flatlining above [..]

post-image

Technical Analysis – US 100 index flatlines between key boundaries

Posted on August 9, 2022 at 9:02 am GMT

The US 100 stock index (cash) added more credence to its ongoing bullish wave after setting a strong foothold around June’s ceiling of 12,896 at the end of July, where the 38.2% Fibonacci retracement of the 6,634 – 16,767 upleg and a broken resistance line are also positioned. Some discomfort, however, seems to be growing as the index is flatlining just after touching the tentative descending trendline from December. The RSI and the Stochastics have recently pivoted southwards near their overbought [..]

Risk Warning: Your capital is at risk. Leveraged products may not be suitable for everyone. Please consider our Risk Disclosure.