XM does not provide services to residents of the United States of America.

Technical Analysis

post-image

Technical Analysis – EURUSD returns within a sideways range

Posted on May 7, 2024 at 1:00 pm GMT

EURUSD returns within range between 1.0725 and 1.0930 MACD and RSI detect a lack of directional momentum For the bears to recharge, a break below 1.0725 may be needed The outlook may turn bullish if the price breaks above 1.0930 EURUSD has been in a recovery mode since April 16 when it hit support near the 1.0610 area. Since then, the pair has been respecting an upside support line, which let it on Friday back within the sideways range that has [..]

post-image

Technical Analysis – Gold attempts recovery to only face limitations again

Posted on May 7, 2024 at 8:17 am GMT

Gold stays trapped below 2,325 after Monday’s bounce Technical signals reflect persisting caution   Gold had a positive start to the week, bouncing back above its 20-day exponential moving average (EMA), but the bullish attempt was not strong enough to drive the precious metal successfully above the constraining zone of 2,325. This is where the 23.6% Fibonacci retracement of the February-April uptrend and a former restrictive line are placed. The price seems to have reached a make-or-break point and the technical picture cannot guarantee [..]

post-image

Technical Analysis – WTI futures break below 200 day-SMA

Posted on May 3, 2024 at 7:22 am GMT

WTI futures retreat below both 50 and 200-day SMAs Violate ascending channel in place since November Oscillators approach oversold conditions   WTI oil futures (June delivery) had been in a steady uptrend since December, posting a fresh six-month peak of 86.90 on April 12. However, the price has been undergoing a pullback since then, dropping beneath both its 50- and 200-day simple moving averages (SMAs) to a fresh one-month low on Thursday. Should the decline resume, immediate support could be found at 78.30, which [..]

post-image

Technical Analysis – GBPJPY returns to pre-intervention levels

Posted on May 2, 2024 at 2:27 pm GMT

GBPJPY tries to record another red candle, well below its recent record high level The BoJ intervenes again since the Fed remains concerned about inflation Momentum indicators are mixed, stochastics acknowledge the bearish pressure GBPJPY is hovering around the busy 191.47-192.57 range and far below its new 16-year high of 200.50. The market is digesting the repeated BoJ interventions with the latest action most likely caused by the Fed’s unwillingness to open the door to rate cuts. Japanese authorities could [..]

post-image

Technical Analysis – Bullish pressure in AUDUSD lingers

Posted on May 2, 2024 at 6:45 am GMT

AUDUSD in the green again today, above the 50-day SMA The bullish tendency manifesting since the April low persists Momentum indicators mostly mixed; stochastics could send a bullish signal AUDUSD is recording another green candle as the market appears to be relieved that Fed Chairman Powell did not mention rate hikes as a viable policy option at Wednesday’s press conference. AUDUSD is currently battling with the 50-day simple moving average (SMA) and possibly on its way to break the recent [..]

post-image

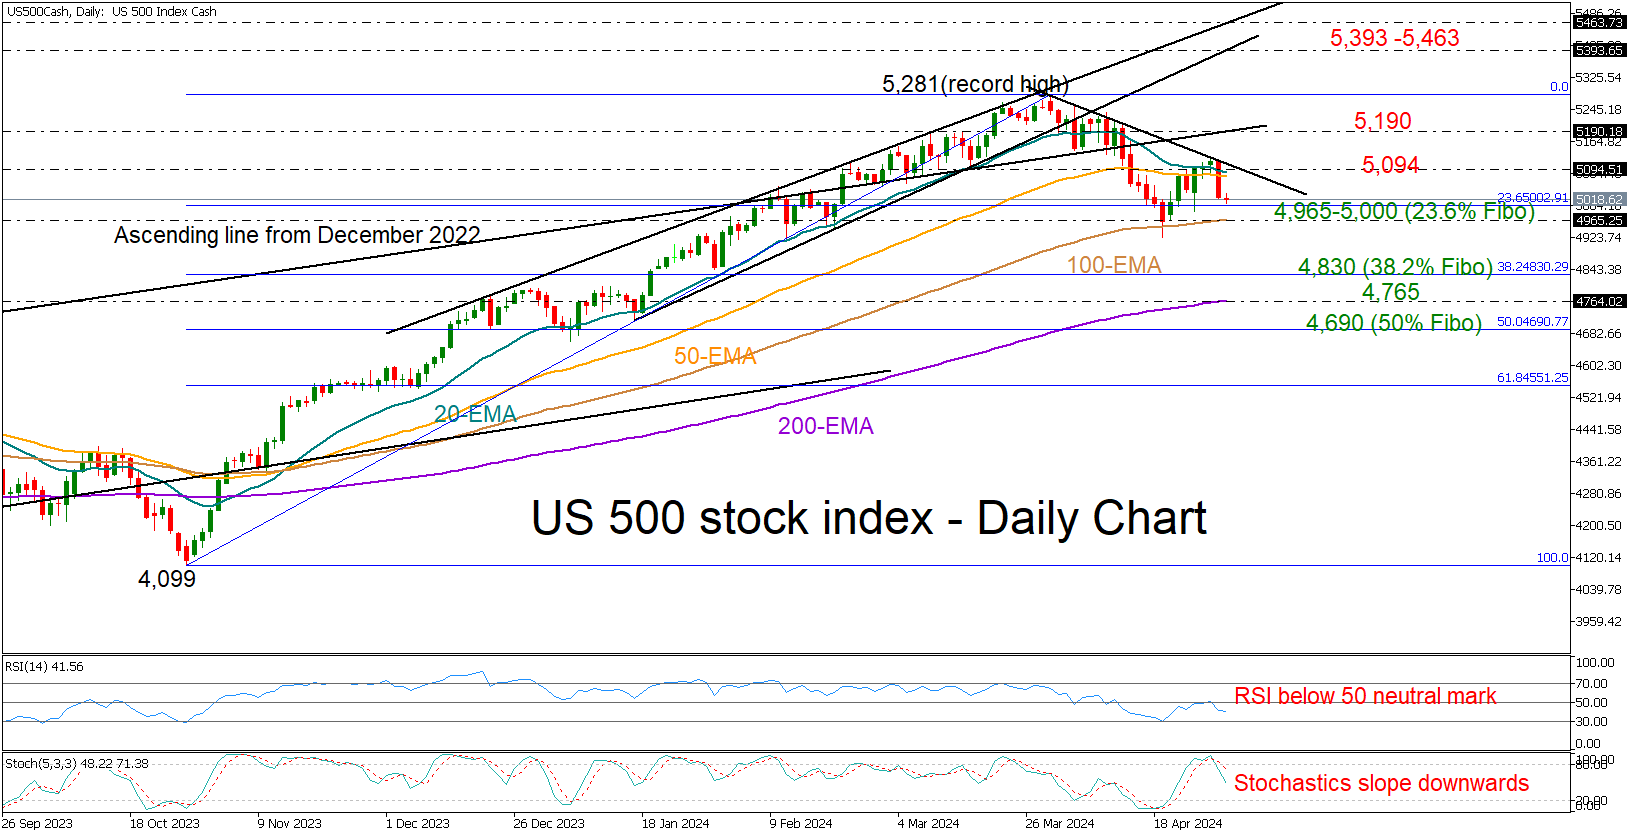
Technical Analysis – US 500 index might hit lower levels after Tuesday’s slump

Posted on May 1, 2024 at 2:49 pm GMT

US 500 index exposed to more downside after Tuesday’s pullback Short-term risk is negative. Will the bears crack the floor at 4,965-5,000?   The US 500 stock index (cash) traded flat at the start of the US open as investors waited for the FOMC policy announcement today at 18:00 GMT. Despite the current muted tone in the market, the short-term outlook does not look promising, especially after the price got hammered near the resistance line from April’s record high for [..]

post-image

Technical Analysis – NZDUSD falls back towards 5-month low

Posted on May 1, 2024 at 2:27 pm GMT

NZDUSD declines sharply after rebound falters Price approaches is lowest level in five months Oscillators are stuck in negative territories   NZDUSD has been in an aggressive downtrend since its double rejection at the 0.6217 region in early March. Although the bulls showed some signs of life following the bounce off the five-month bottom of 0.5851, the pair is back on track to extend its series of lower highs and lower lows. Should the retreat extend, the pair may face the 0.5858-0.5851 [..]

post-image

Technical Analysis – Gold seeks safety after Tuesday’s drop

Posted on May 1, 2024 at 7:52 am GMT

Gold trends lower in the short-term picture, near oversold territory Stronger buying needed above 2,355 for a bullish outlook FOMC policy announcement due today at 18:00 GMT   Gold bears took control on Tuesday, pressing the price below the resistance-turned-support trendline, which halted last week’s decline, and towards the 200-period exponential moving average (EMA) in the four-hour chart at 2,280. In the technical indicators, the RSI and the stochastic oscillator have stabilized their downfall near their previous lows within the [..]

post-image

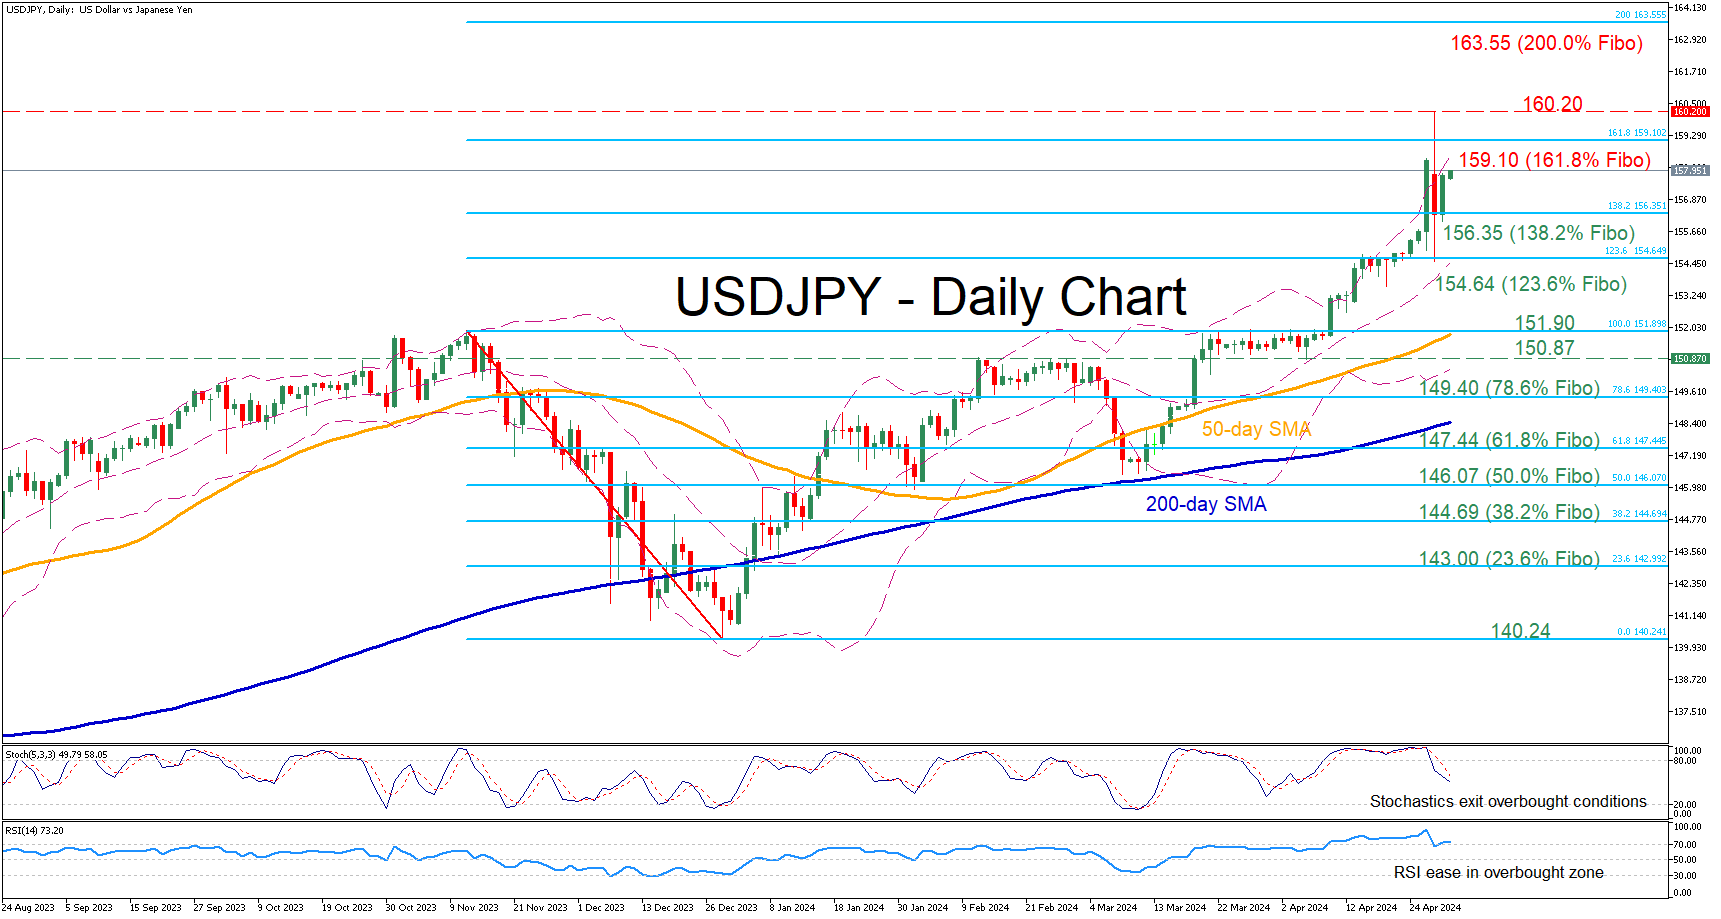
Technical Analysis – USDJPY stabilizes a tad below 160.00

Posted on May 1, 2024 at 7:35 am GMT

USDJPY jumps to its highest level since April 1990 A suspected Japanese intervention does not have meaningful impact Oscillators exhibit a divergence regarding overbought conditions USDJPY has been in a steady uptrend since the beginning of the year, posting a fresh 34-year high on Monday. After a roller coaster session that day following speculation over a Japanese intervention, the pair experienced a strong sell off before recouping a significant part of its losses. Should bullish pressures persist, the price could [..]

post-image

Technical Analysis – Is US 100 setting course for new record highs?

Posted on April 30, 2024 at 12:28 pm GMT

US 100 enters recovery mode, stays above uptrend line MACD and RSI suggest that momentum may turn positive A break above 18,350 will take the index into uncharted territory A break below 15,700 may turn the broader outlook bearish The US 100 cash index entered a recovery mode last week, after hitting support near the 16,980 zone. Overall, the index is trading above a long-term uptrend line drawn from the low of January 6, 2023, as well as above its [..]

Risk Warning: Your capital is at risk. Leveraged products may not be suitable for everyone. Please consider our Risk Disclosure.