XM does not provide services to residents of the United States of America.

Technical Analysis

post-image

Implied Volatility Report – October 10, 2023

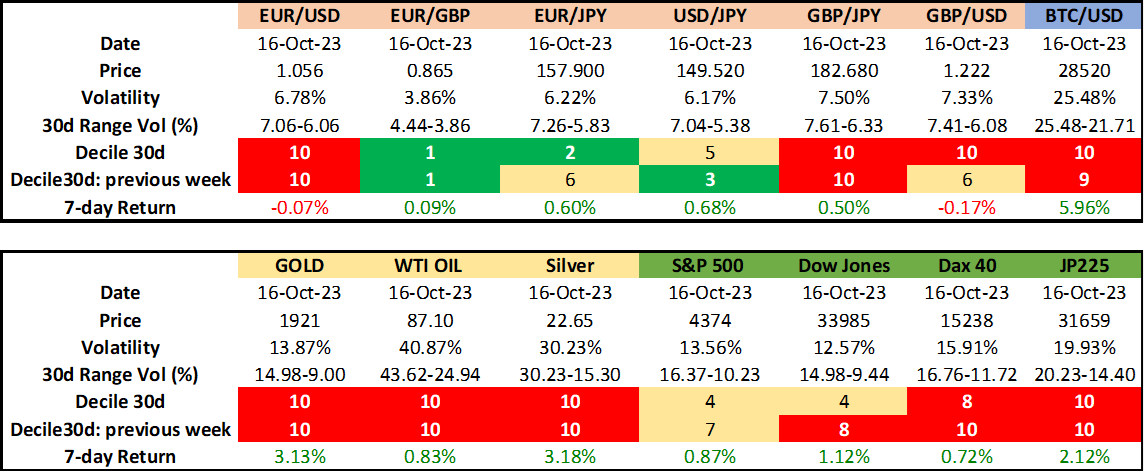
Posted on September 30, 2022 at 11:34 am GMT

EUR/USD volatility remains extremely elevated, most JPY crosses at the other end of the spectrum Expected volatility of precious metals and oil stay at month-highs US stock indices in calmer waters; Bitcoin at the highest of its volatility range EUR/USD expected volatility remains extremely high despite the marginal weekly negative return. On the flip side, yen crosses are expected to experience very low volatility going forward with the exception of GBP/JPY. In commodities, gold and silver expected volatility has jumped [..]

Technical Analysis – GBPJPY rebounds swiftly from its sharp drop as bias turns bullish

Posted on September 30, 2022 at 7:47 am GMT

GBPJPY has experienced some large moves in the short term, with the price losing around 10% before it recovers back above the 160.00 mark. Moreover, the technical picture is currently endorsing the resumption of the rebound as the pair has forcefully crossed above the ascending 200-day simple moving average (SMA). The momentum indicators suggest that near-term risks are tilted to the upside. Specifically, the stochastic oscillator is ascending near the 80-overbought region, while the RSI has rebounded from the oversold [..]

post-image

Technical Analysis – USDCHF tries to regain some momentum after aggressive decline

Posted on September 30, 2022 at 7:38 am GMT

USDCHF had a strong bearish day on Wednesday, losing more than 2%, sending the market down near the 20-day simple moving average (SMA). Currently, the price is gaining some ground with the technical indicators still holding in the positive region. The MACD oscillator is holding above its trigger and zero lines, while the RSI is sloping marginally up above the 50 level. Should the price move decisively higher, bulls could extend the uptrend towards the 0.9985 barrier ahead of the [..]

Technical Analysis – USDCAD curbs exponential growth; support at 1.3600

Posted on September 30, 2022 at 6:56 am GMT

USDCAD switched to consolidation after its exponential advance above a bullish channel topped at 1.3831. Of note, the area coincides with the 61.8% Fibonacci retracement of the March 2020 – June 2021 downtrend. Encouragingly, the 1.3600 region helped the market to retain some weekly gains, but with the RSI and the stochastics hovering in overbought waters, it’s questionable how far the rally could still go. Nevertheless, with the indicators remaining elevated within the bullish territory, there might be some room for further improvement [..]

post-image

Technical Analysis – ETHUSD consolidates after decline pauses

Posted on September 29, 2022 at 2:03 pm GMT

ETHUSD has been trending downwards since mid-August when the price failed to surpass the 2,030 mark. Even though Ethereum experienced an acceleration of its decline following the successful completion of the Merge two weeks ago, it has been trading sideways in the last few daily sessions. The momentum indicators currently suggest that the negative forces are waning but continue to hold the upper hand. Specifically, the MACD histogram is found above its red signal line but in the negative territory, while the stochastic [..]

post-image

Technical Analysis – Will silver erase its Wednesday rebound?

Posted on September 29, 2022 at 1:28 pm GMT

Silver jumped on Wednesday after triggering some buy orders near the 17.95 zone. However, the spike up was stopped by the 18.95 level, slightly above the 50-period exponential moving average (EMA) and near the 100-EMA. This prints a lower high on the daily chart and combined with the fact that the 200-EMA is also hovering above the price action, it suggests that another round of selling could be looming. The RSI slid back below 50, while the Stochastic exited its [..]

post-image

Technical Analysis – CHFJPY stands in medium-term ascending channel after sharp sell-off

Posted on September 29, 2022 at 1:25 pm GMT

CHFJPY is gaining some ground after the sharp selling interest in the preceding sessions, while it is currently flirting with the 20-day simple moving average (SMA). The technical oscillators are following the neutral-to-negative reaction in the market in the short-term timeframe. The RSI is ticking down in the positive region, while the MACD is losing momentum below its trigger line in the bullish area as well. Therefore, a reversal to the upside is on the cards, though remaining in the medium-term ascending channel. If the pair manages [..]

post-image

Technical Analysis – EURUSD rebounds but stays below downside line

Posted on September 29, 2022 at 10:21 am GMT

EURUSD rebounded strongly yesterday after hitting support near the crossroads of the 0.9535 zone and the lower bound of the downward sloping channel that’s been containing the price action since January 28. That said, the recovery remained limited near the 0.9750 territory, still below the short-term downside line drawn from the high of September 13. All this, combined with the fact that the price remains below all three of the plotted moving averages, paints a negative picture. The RSI moved [..]

post-image

Technical Analysis – EURAUD flirts with strong resistance at 1.4965

Posted on September 29, 2022 at 9:17 am GMT

EURAUD is travelling above the near-term uptrend line that has been drawn since the more-than-five-year low of 1.4280 that was reached at the end of August. The pair is battling with the 1.4665 resistance level ahead of the 200-day simple moving average (SMA), which is acting as a strong barrier for the bulls. Regarding the technical indicators, the RSI is moving up above the neutral threshold of 50, approaching the 70 level, while the stochastic has turned down before meeting the overbought level. A successful climb [..]

Technical Analysis – AUDUSD detects oversold conditions near fresh lows

Posted on September 29, 2022 at 7:45 am GMT

AUDUSD was trimming Wednesday’s quick bounce from the 29-month low of 0.6362 during Thursday’s early European trading hours, but the completed doji candlestick pattern continued to feed hopes for an upside reversal. Given the price’s continuous contact with the lower Bollinger band over the past month, the odds are favoring the bulls. The RSI and the stochastics are adding to this optimism as the indicators are trying to exit the oversold territory. Nevertheless, buyers could hold up until the price successfully claims the [..]

Risk Warning: Your capital is at risk. Leveraged products may not be suitable for everyone. Please consider our Risk Disclosure.