XM does not provide services to residents of the United States of America.

Technical Analysis

Technical Analysis – USDCAD seems to return to gains; nearby resistance eyed for confirmation

Posted on October 7, 2022 at 7:05 am GMT

USDCAD is gaining sustainable ground, finding support at the 1.3505 barrier. The 20- and 50-day simple moving averages (SMAs) are following the upward movement; however, the technical oscillators are weakening their momentum. The MACD is standing beneath its trigger line in the positive area, while the RSI is flattening above the neutral threshold of 50. Traders would be more eager to engage in buying activities if the price manages to surpass the nearby resistance at 1.3840, where the 29-month high is [..]

post-image

Technical Analysis – US 100 stock index hits a wall at 20-day MA as rebound stalls

Posted on October 6, 2022 at 2:49 pm GMT

US 100 stock index (cash) slumped to a two-year low of 10,836.34 on Monday before quickly turning higher. But the bounce back appears to be facing some difficulty after running into the 20-day moving average (MA) at 11,695. A tad higher lies the 50% Fibonacci retracement level of the uptrend from March 2020 to November 2021, adding even more weight to the resistance area of 11,700. The momentum indicators are flashing some warning signs about the sustainability of this upswing, [..]

post-image

Technical Analysis – GBPAUD returns within neutral zone

Posted on October 6, 2022 at 2:26 pm GMT

GBPAUD entered a rally mode last week after tumbling and hitting support at 1.5930. The recovery was strong enough to take the pair back within the sideways range that contained the price action between March 18 and August 10, and although sellers jumped back into the action yesterday from near the 1.7660 hurdle, they remain within that range. So, as long as GBPAUD is trading within that sideways range, between 1.7200 and 1.7825, the outlook will stay neutral. The RSI [..]

post-image

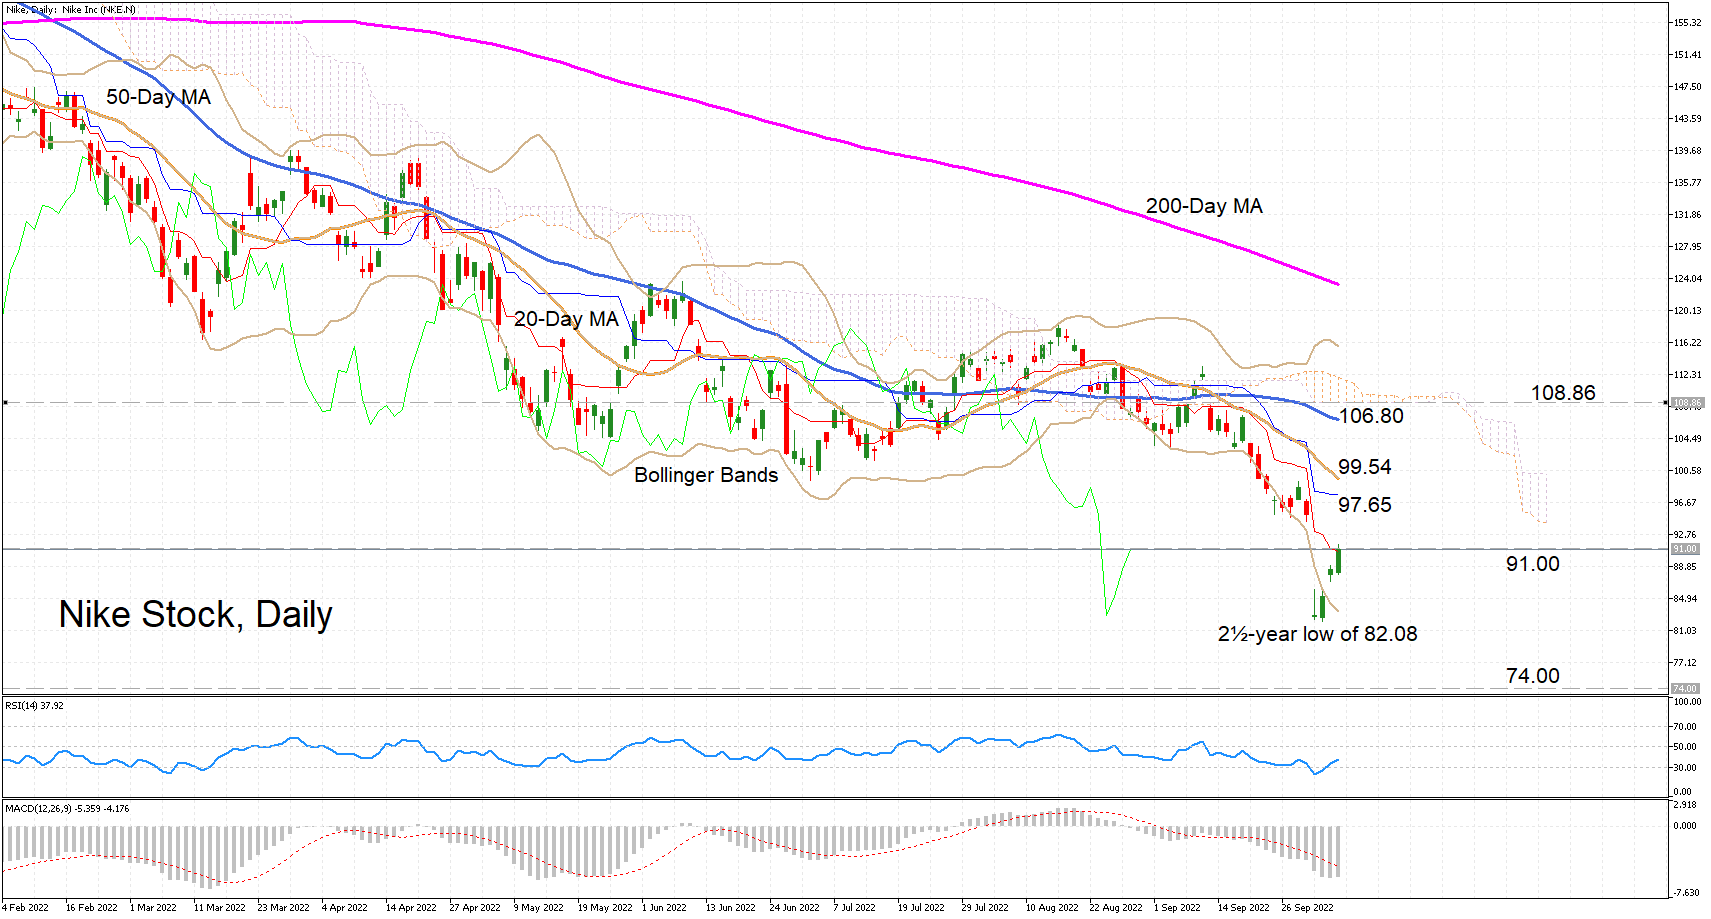
Technical Analysis – Nike stock bounces back from 2½-year low but outlook still bearish

Posted on October 6, 2022 at 1:04 pm GMT

Nike stock has staged an impressive rebound from the two-and-a-half year low of 82.08 plumbed on October 3 but it nevertheless remains deep in bearish territory. The RSI has climbed out of the oversold region, though it is some distance away from reaching the 50 neutral level. The MACD histogram appears to be bottoming out but is not yet near to crossing above the red signal line, which is still falling. Moreover, although the price has jumped back above the [..]

post-image

Technical Analysis – EURUSD meets 200-period SMA and tests 0.9900

Posted on October 6, 2022 at 11:21 am GMT

EURUSD is underperforming after the pullback off the 200-period simple moving average (SMA) around 0.9920. The pair is approaching the near-term uptrend line near the 0.9900 psychological mark and the 20-period SMA. The RSI is sloping south in the bullish area; however, the stochastic is still moving higher after the bullish cross within the %K and %D lines. Should weakness extend below the uptrend line, support to downside movements could be initially detected within the 0.9835 barrier. Clearing that zone, [..]

Technical Analysis – WTI oil futures within caution zone despite rebound

Posted on October 6, 2022 at 7:52 am GMT

WTI oil futures (November delivery) are heading for their largest weekly gain since May, with the price stretching its bounce off the nine-month low of 76.25 up to 88.42 on Wednesday. The market managed to close marginally above the 50-day simple moving average (SMA) too, as it did in late August when the price immediately changed direction to the downside. A repetition of that incident is possible since the RSI has yet to overcome its previous high above its 50 [..]

Technical Analysis – AUDUSD consolidates in short-term; broader outlook is bearish

Posted on October 6, 2022 at 6:40 am GMT

AUDUSD has been moving sideways over the last week, consolidating within the 0.6367 support and the 0.6550 resistance. In trend indicators, the 20- and 50-day simple moving averages (SMAs) are heading south, confirming the long-term bearish outlook, while the MACD is holding above its trigger line in the negative region and the RSI is sloping up below the neutral threshold of 50. A failure to overcome the 0.6550 resistance level could send the price down to the 29-month low of [..]

post-image

Technical Analysis – BTCUSD capped by 50-day MA as upside runs into trouble

Posted on October 5, 2022 at 2:22 pm GMT

BTCUSD has been trading in an increasingly narrow range over the last month and the sideways action looks set to last a while longer as the latest attempt at cracking above the 20,000 level has hit a stumbling block. Making matters more difficult for the bulls is the fact that the 50-day moving average (MA) has now entered this region, creating a strong resistance around the 20,000 mark. The momentum indicators are mixed: the RSI has turned lower but is [..]

post-image

Technical Analysis – Twitter flies and hits 52.00

Posted on October 5, 2022 at 2:05 pm GMT

Twitter’s stock skyrocketed on Wednesday after Elon Musk expressed interest again in buying the social media firm for $54.20 a share. From a technical standpoint, the share price has been printing higher lows since July 7 and thus, even if it pulls back after the overstretched rally, the bulls may remain interested and recharge at some point soon. The RSI and the MACD detect strong upside speed and support the notion for further advances. The former lies above 70, while the [..]

post-image

Technical Analysis – Gold faces profit taking after quick rally

Posted on October 5, 2022 at 10:23 am GMT

Gold drifted lower and back into the broken 2022 bearish channel after its two-day exciting rally stalled at 1,729 – the highest since September 13. The RSI and the stochastics have abandoned the overbought region, raising concerns that the latest bullish wave has probably peaked. The weakness in the MACD is also endorsing the current negative momentum in the price. Nevertheless, sellers would not be ruining the short-term positive trajectory unless they drive forcefully below the 200-period simple moving average (SMA) and [..]

Risk Warning: Your capital is at risk. Leveraged products may not be suitable for everyone. Please consider our Risk Disclosure.