XM does not provide services to residents of the United States of America.

Technical Analysis

post-image

Technical Analysis – GBPUSD advances above 200-day SMA

Posted on May 14, 2024 at 7:08 am GMT

GBPUSD looks neutral in very short-term A jump above 1.2630 could add some optimism Stochastic and MACD are mixed GBPUSD has successfully jumped above the 200-day simple moving average (SMA) with the next crucial obstacle coming from the short-term downtrend line and the 50-day SMA around 1.2590. Technically, the MACD oscillator is still developing with weak momentum above its trigger line and below the zero level, while the stochastic is extending its upside movement towards the overbought region after the [..]

post-image

Technical Analysis – US 100 index hovers above cloud as rebound loses steam

Posted on May 13, 2024 at 10:37 am GMT

US 100 stock index eyes March all-time high But latest upleg may have run its course Is a correction on the way or is a record peak in sight?   The US 100 stock index (cash) has recovered by more than 7% from the April dip when it hit a three-month low of 16,970.00. But despite climbing on top of the Ichimoku cloud and surpassing the 18,000.00 level, the bullish prospects for the near term have started to fade. The [..]

Weekly Technical Outlook – EURUSD, GBPUSD, AUDUSD

Posted on May 13, 2024 at 8:45 am GMT

US CPI report may show the next direction of EURUSD UK employment data may take GBPUSD down Is Australia labour report strong enough to take AUDUSD out of trading range? US CPI data –> EURUSD During the previous week’s meeting, the Federal Reserve displayed a less aggressive stance than anticipated, as Chair Powell explicitly stated that there would be no increases in interest rates and suggested that they are still inclined towards reducing rates. Traders will focus on the US [..]

post-image

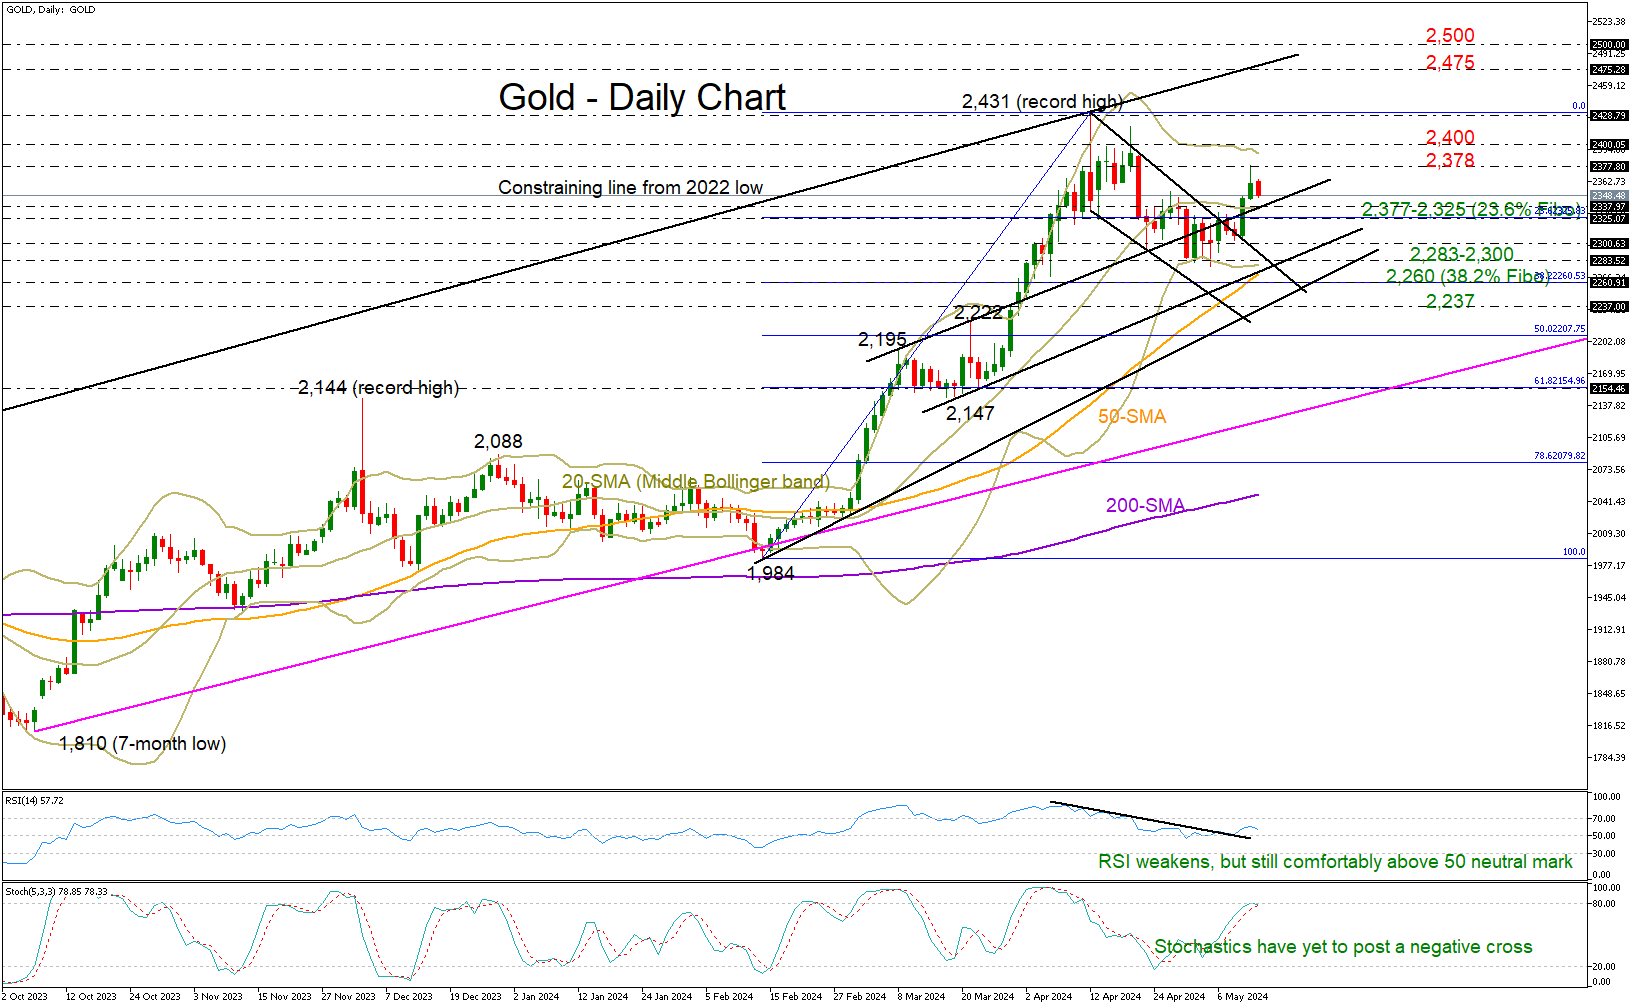
Technical Analysis – Gold loses some ground but still bullish

Posted on May 13, 2024 at 8:29 am GMT

Gold loses momentum after reaching a two-week high Short-term risk remains skewed to the upside above 2,325   The week began with gold losing ground and giving up the gains it made on Friday when it reached a two-week high of 2,378. Technically, the bounce back above the resistance line from March and the 20-day simple moving average (EMA) feeds optimism that the latest upturn could resume as the RSI keeps fluctuating clearly above its 50 neutral mark and the price has [..]

post-image

Technical Analysis – GBPJPY continues to ascend

Posted on May 10, 2024 at 12:40 pm GMT

GBPJPY keeps climbing higher, above the recent rectangle pattern GBPJPY bulls survived last week’s interventions by the BoJ Momentum indicators have turned bullish GBPJPY is recording its fifth consecutive green candle, most likely closing the week around 2% up from last Friday’s close. Despite the recent weak US labour market report, the yen has failed to maintain any momentum from last week’s double intervention by the BoJ, surrendering most of its gains. With the verbal interventions being ignored by the [..]

post-image

Technical Analysis – AUDUSD remains undecided near crucial technical region

Posted on May 10, 2024 at 8:01 am GMT

AUDUSD repeatedly fails to conquer the 0.6643-0.6666 range But outlook is positive as price holds above 50 and 200-day SMAs Momentum indicators deteriorate but remain in positive zones AUDUSD has been in a steady advance since its bounce off the five-month low of 0.6363 in mid-April. Although the pair has been rejected at the 0.6643-0.6666 range three times so far in 2024, the bulls do not seem ready to give up. If buying pressures persist, the price may initially test the [..]

post-image

Technical Analysis – USDCAD slips beneath 20-day SMA

Posted on May 10, 2024 at 7:38 am GMT

USDCAD may retest the uptrend line MACD and RSI lose steam USDCAD is sliding beneath the 20-day simple moving average (SMA) and is approaching the medium-term ascending trend line around the 1.3630-1.3610 support region. Technically, the MACD oscillator is holding beneath its trigger line in the positive area; however, the RSI is weakening and is moving horizontally near the neutral threshold of 50. In case of steeper decreases the market may rest near the 50-day SMA at 1.3618 and any [..]

post-image

Technical Analysis – UK 100 index swings to all-time high

Posted on May 9, 2024 at 12:02 pm GMT

UK 100 hits record high after the BoE rate decision; up 8% year-to-date Next target at 8,500, but fears of an overbought market might delay rally The UK 100 stock index (cash) has been performing incredibly well over the past four months, staging another exponential rally this week to unlock an all-time high of 8,393 on Thursday. The index has surpassed a couple of targets, including the 2023 top of 8,045 that temporarily ceased bullish actions on April 12. The spotlight [..]

post-image

Technical Analysis – BTCUSD retreats after unsuccessful test of 50-SMA

Posted on May 9, 2024 at 11:43 am GMT

BTCUSD drops after failing to claim 50-day SMA The price extends its series of lower highs and lows Momentum indicators are tilted to the downside BTCUSD (Bitcoin) had been in a slow but steady recovery since its bounce off the two-month bottom of 56,483. However, the rebound faltered and the price reversed back lower following its second unsuccessful attempt to conquer the 50-day simple moving average (SMA). Should Bitcoin extend its pullback, the March-April support of 59,400 might curb initial downside attempts. [..]

Risk Warning: Your capital is at risk. Leveraged products may not be suitable for everyone. Please consider our Risk Disclosure.