XM does not provide services to residents of the United States of America.

Technical Analysis

Technical Analysis – EURUSD retraces lower as 200-day SMA rejects advance

Posted on November 21, 2022 at 9:03 am GMT

EURUSD has been attempting a rebound in the short term after escaping its descending channel to the upside. However, in the past few daily sessions, the advance has paused as the price has been constantly held down by the 200-day simple moving average (SMA). The short-term oscillators currently suggest that bullish forces are waning but remain in control. Specifically, the RSI is pointing downwards above its 50-neutral mark, while the MACD histogram is softening above both zero and its red signal line. [..]

Technical Analysis – Gold poised for downside recovery ahead of more bullish actions

Posted on November 21, 2022 at 7:57 am GMT

Gold prices have been in a declining movement since the pullback off the 1,786 resistance level; however, the bullish crossover within the 20- and the 50-day simple moving averages (SMAs) are suggesting more upside structure in the short-term. From a technical perspective, the short-term bias is viewed as negative, reflected by the downward move in the RSI and the MACD. The former is heading south after the touch in the overbought area, while the MACD is weakening its momentum in the [..]

post-image

Technical Analysis – JP 225 index consolidates as latest advance pauses

Posted on November 18, 2022 at 1:58 pm GMT

The JP 225 index (cash) has been in a steep uptrend since late September, generating consecutive higher highs and higher lows. However, the index has been trading sideways in the last few daily sessions after the latest advance came to a halt at the 28,328 region. The short-term oscillators are currently endorsing a positive near-term tone. Specifically, the MACD is above both zero and its red signal line, while the RSI is hovering beyond its 50-neutral mark. To the upside, further [..]

post-image

Technical Analysis – GBPJPY extends advance as positive momentum strengthens

Posted on November 18, 2022 at 12:14 pm GMT

GBPJPY has experienced a steep uptrend since late September, with the price gaining almost 15% and posting a fresh 6½-year high of 172.10. Even though the pair declined moderately from its recent peak, it has been attempting a rebound in the last few daily sessions. The short-term oscillators are indicating that bullish forces are strengthening. Specifically, the RSI has crossed above its 50-neutral mark, while the stochastic oscillator is ascending near the 80-overbought region. In the positive scenario, should buying pressures persist, the price [..]

post-image

Technical Analysis – UK 100 index strengthens bullish bias after budget statement

Posted on November 18, 2022 at 12:11 pm GMT

The UK 100 stock index (cash) returned to gains after investors interpreted the UK’s much anticipated tax plan as an effort from the government to restore economic and political stability. The bounce on the 20-period simple moving average (SMA) at 7,350 prompted another bullish correction above the 7,400 resistance territory on Friday, strengthening the short-term bullish bias. The RSI on the four-hour chart is currently making new higher highs above its 50 neutral mark, while the MACD is growing within the positive area and above [..]

Technical Analysis – EURGBP lacks bullish mood; support at 0.8700

Posted on November 18, 2022 at 9:13 am GMT

EURGBP has been in a consolidation phase over the past two weeks, maintaining a foothold above the 0.8700 level and the support trendline drawn from the August low of 0.8338. The momentum indicators currently reflect a neutral-to-bearish bias. The RSI and the MACD have been gradually diminishing over the past week, with the former looking for a break below its 50 neutral mark and the latter flirting with its red signal line. Meanwhile, the falling stochastics have yet to enter the oversold [..]

Technical Analysis – USDCAD still flattens above the 1.3225 key level

Posted on November 18, 2022 at 8:05 am GMT

USDCAD is hovering above the 1.3300 mark after several days of trying to break the 1.3225 support level. The short-term bias is neutral to bearish as the RSI is flattening below the neutral threshold of 50; however, the stochastic is showing positive signs as the %K and the %D lines posted a bullish crossover in the oversold zone. If the market rises, it may encounter opposition between the bearish cross of the 20-day and 50-day simple moving averages (SMAs) at 1.3530 and [..]

post-image

Technical Analysis – AUDJPY stays within a range

Posted on November 17, 2022 at 3:14 pm GMT

AUDJPY traded lower today, but it is still holding above the 93.00 zone, which has been providing support since October 24. Overall, the pair remains within the sideways range that’s been containing most of the price action since March 24 and thus, the medium-term picture is still neutral for now. The daily oscillators detect some further downside pressure, perhaps until the range’s lower bound, at around 91.00. The RSI hit resistance at its 50 line, while the MACD lies below [..]

post-image

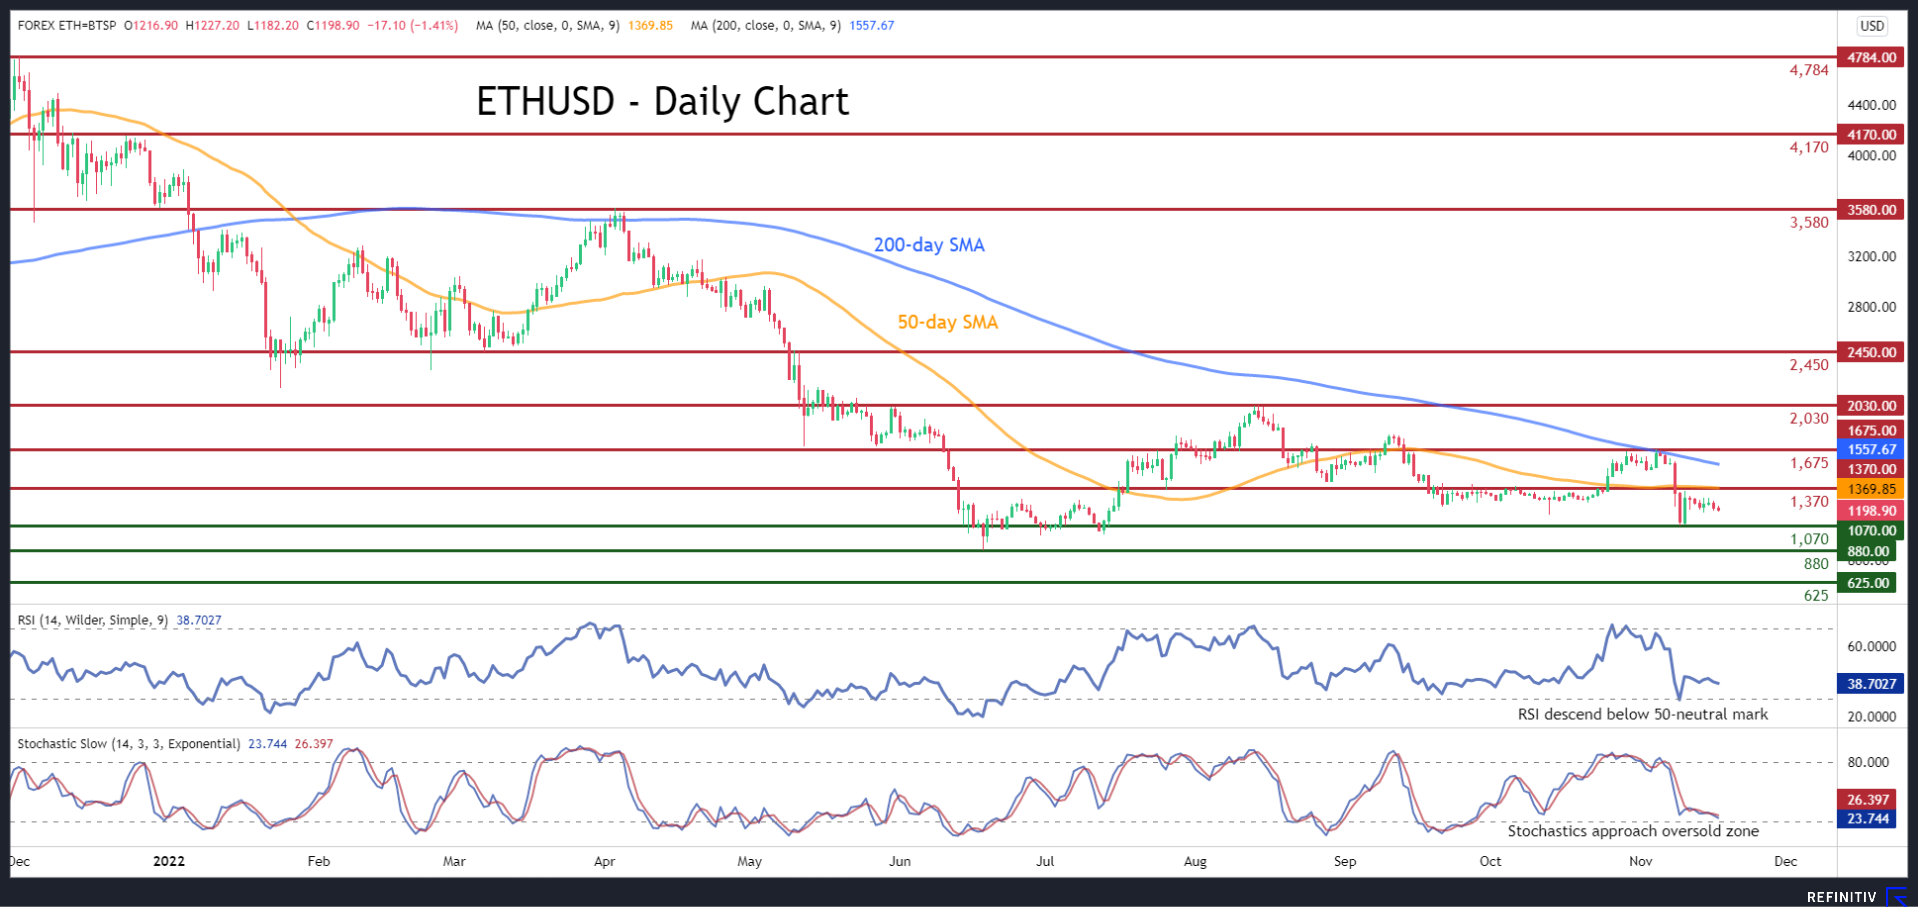
Technical Analysis – ETHUSD rangebound after decline pauses

Posted on November 17, 2022 at 1:45 pm GMT

ETHUSD (Ethereum) has experienced a sharp decline in the short term, with the price hitting a fresh four-month low of 1,070. However, the cryptocurrency managed to recover some ground and has been trading sideways in the last few daily sessions. The momentum indicators currently reflect that near-term risks remain tilted to the downside. Specifically, the RSI is declining beneath its 50-neutral mark, while the stochastic oscillator is descending near its 20-oversold region. Should sellers push the price lower, immediate support [..]

post-image

Technical Analysis – WTI oil futures retreat below 50-day SMA

Posted on November 17, 2022 at 11:08 am GMT

WTI oil futures (January delivery) have been stuck in a downtrend since mid-June when the price failed to surpass the 121.00 mark. Although the commodity managed to regain some ground after bouncing at the nine-month low of 76.25, the price has dropped again below its 50-day simple moving average (SMA). The momentum indicators currently suggest that bearish forces are strengthening. Specifically, the RSI has dived beneath the 50-neutral mark, while the MACD histogram is retreating below both zero and its red signal line. [..]

Risk Warning: Your capital is at risk. Leveraged products may not be suitable for everyone. Please consider our Risk Disclosure.