XM does not provide services to residents of the United States of America.

Technical Analysis

post-image

Technical Analysis – US 500 index pulls back off 200-day SMA once again

Posted on November 28, 2022 at 9:46 am GMT

The US 500 cash index found significant resistance near the 200-day simple moving average (SMA) near 4,040, indicating that the long-term outlook remains negative. The RSI indicator is pointing downwards in the bullish territory; however, the MACD is still extending its bullish structure above its trigger line. Moving lower again, immediate support could come from the 100-day SMA at 3,920 ahead of the 3,900 barrier. If the bears drive the index further down, they could take the price towards the 50-day [..]

Technical Analysis – EURUSD fights stubbornly for 1.0400

Posted on November 28, 2022 at 9:19 am GMT

EURUSD opened with a slight negative gap on Monday after getting rejected around the 1.0400 psychological level for the second time last week. The bulls are currently making another attempt to breach that wall and keep the bullish bias intact above the 200-day exponential moving average (EMA). But the momentum indicators are reflecting some cracks in buying interest. Specifically, the RSI has made a new lower high after peaking near its 70 overbought level, the stochastics are looking to change direction to the downside, [..]

Technical Analysis – Gold consolidates after advance pauses

Posted on November 28, 2022 at 9:16 am GMT

Gold has been losing ground since early March, generating a profound structure of lower highs and lower lows within a descending channel. Even though bullion recovered some ground after managing to cross above its restrictive trendline in early November, its rebound currently appears to be running out of steam. The momentum indicators currently suggest that bullish forces are holding the upper hand. Specifically, the RSI has flatlined above its 50-neutral mark, while the stochastic oscillator is ascending near the 80-overbought zone. [..]

Technical Analysis – GBPJPY maintains weak bias in near-term; broader trend is bullish

Posted on November 25, 2022 at 8:40 am GMT

GBPJPY is retreating somewhat above the downward sloping short-term simple moving averages (SMAs). The rebound off the 162.95 support level lasted until the 169.05 resistance level, with the technical oscillators confirming the recent sideways move. The RSI is flattening above the neutral threshold of 50, while the MACD is standing above its trigger line in the positive region, but the momentum is very weak. Should prices reverse lower, immediate support could come from the 20-day SMA at 167.10 ahead of the [..]

Technical Analysis – USDCAD retreats as latest recovery fades

Posted on November 25, 2022 at 7:49 am GMT

USDCAD has been in an uptrend since March, storming to a fresh 29-month high of 1.3976 before experiencing a significant downside correction. Even though the pair managed to erase part of the recent pullback, it has been on the retreat again as its latest rebound failed to strengthen. The momentum indicators currently suggest that bearish forces are gaining control. Specifically, the RSI is retreating below its 50-neutral mark, while the stochastic oscillator is descending near the 20-oversold zone. To the downside, [..]

post-image

Technical Analysis – Apple stock in tight range after advance pauses

Posted on November 24, 2022 at 2:54 pm GMT

Apple’s stock has been trending lower since mid-August after meeting strong resistance at the 176.00 region. Nevertheless, the price has been attempting a recovery in the short term, which has paused for now after failing to test the 200-day simple moving average (SMA). The momentum indicators currently suggest that bullish forces are in control. Specifically, the RSI is ascending above its 50-neutral mark, while the MACD histogram is strengthening above both zero and its red signal line. To the upside, [..]

post-image

Technical Analysis – EURUSD bulls look exhausted near 1.0400

Posted on November 24, 2022 at 2:50 pm GMT

EURUSD is weakening somewhat after the climb towards the 1.0450 barrier, which is a level slightly above the 200-period simple moving average (SMA) in the daily chart. Currently, the market is retreating near the 1.0400 psychological mark with the technical oscillators losing steam. The RSI has pulled back from the overbought region, while the MACD is continuing to move in the positive area with weak momentum. Still, the market seems to be well supported by the short-term SMAs around 1.0315-1.0340 and therefore only a decisive [..]

post-image

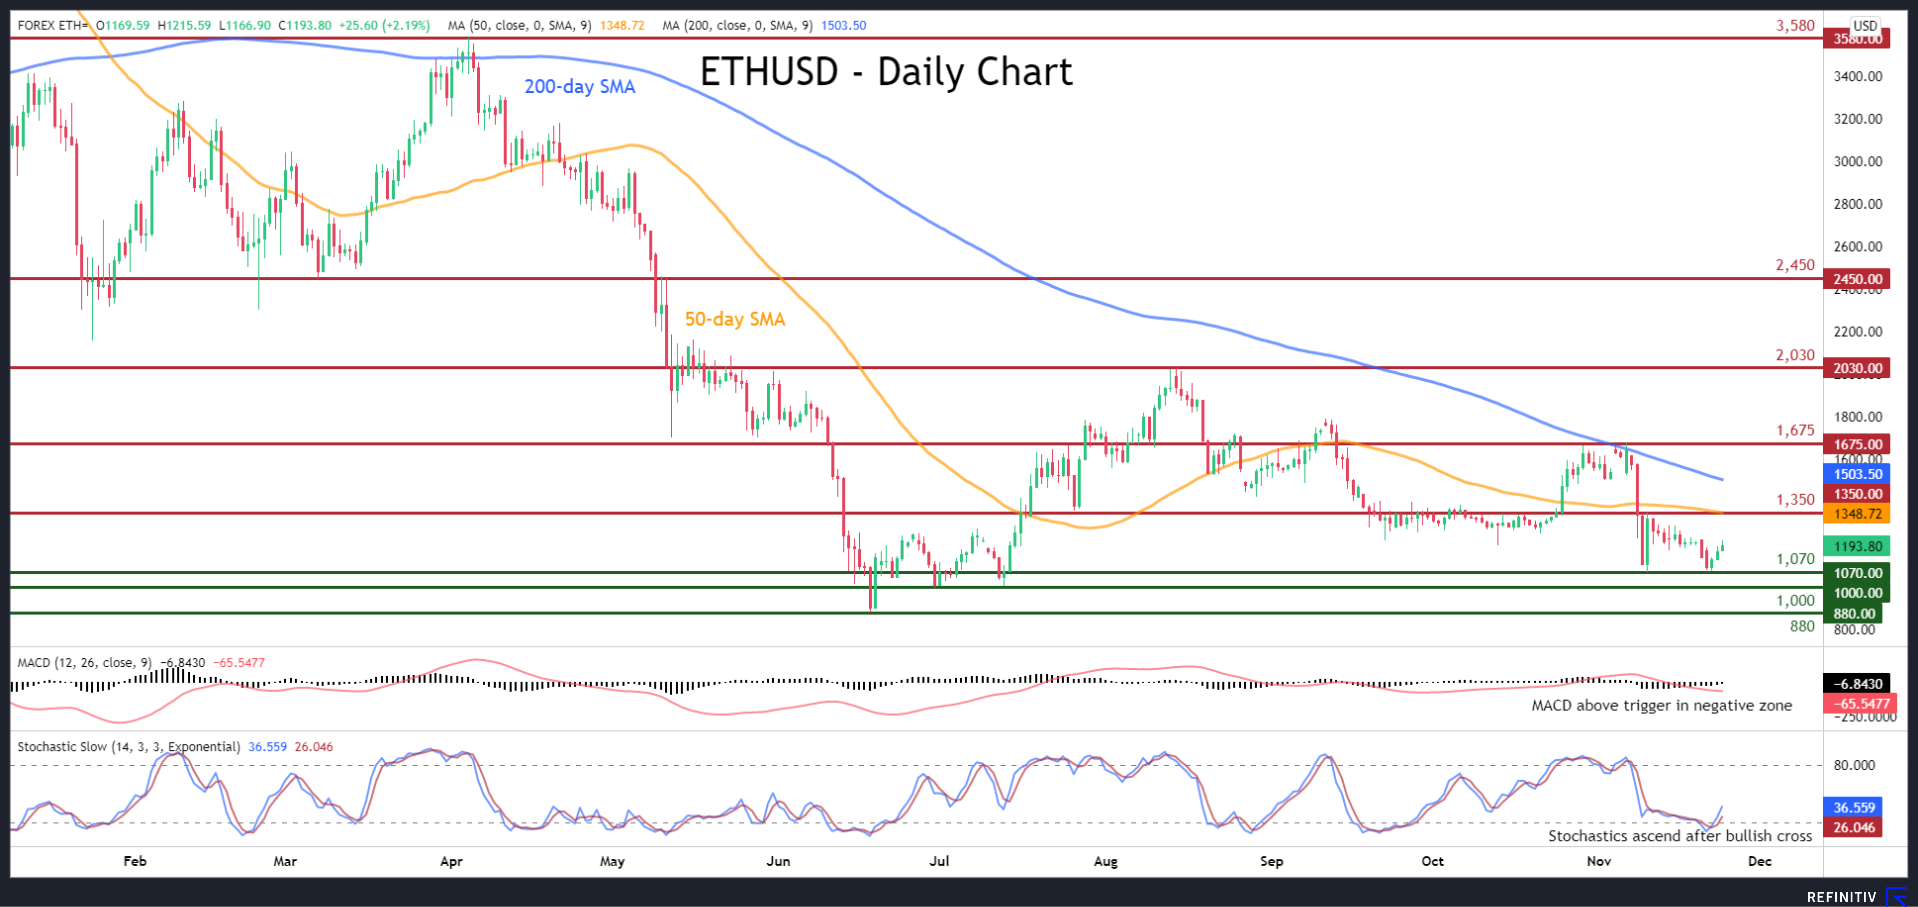
Technical Analysis – ETHUSD gains upside traction after hitting double-bottom

Posted on November 24, 2022 at 12:00 pm GMT

ETHUSD (Ethereum) has experienced a sharp decline in the short term, with the price testing its four-month low of 1,070 twice. However, the cryptocurrency managed to bounce back and recover some ground in the last couple of sessions. The momentum indicators currently reflect that negative risks are subsiding. Specifically, the MACD histogram has crossed above its red signal line but remains in the negative territory, while the stochastic oscillator is sloping upwards after posting a bullish cross. To the upside, bullish [..]

post-image

Technical Analysis – US 30 index bulls meet previous high; positive outlook remains

Posted on November 24, 2022 at 10:36 am GMT

The US 30 cash index is trading around the vicinity of 34,280, that being a high from August 16. The price is having a second attempt to break this level; however, the technical oscillators are suggesting a horizontal trajectory. The RSI is flattening near the overbought level, while the MACD is moving sideways near its trigger line in the positive area. Should buyers drive above the 34,280 resistance, they could encounter initial strengthened resistance from 35,500, taken from the peak [..]

Technical Analysis – AUDUSD erases pullback, eyes recent rejection region

Posted on November 24, 2022 at 8:58 am GMT

AUDUSD has been stuck in a steep downtrend since early March, but it managed to recoup some losses after bouncing at the 30-month low of 0.6169. Even though the recent rebound paused temporarily and the pair exhibited a minor correction in the short term, it has been regaining lost ground in the last few daily sessions. The momentum indicators are endorsing this bullish near-term bias. Specifically, the stochastic oscillator is ascending after posting a bullish cross, while the MACD histogram is strengthening [..]

Risk Warning: Your capital is at risk. Leveraged products may not be suitable for everyone. Please consider our Risk Disclosure.