XM does not provide services to residents of the United States of America.

Technical Analysis

post-image

Technical Analysis – EURCAD builds uptrend; overbought signals strengthen

Posted on November 30, 2022 at 11:30 am GMT

EURCAD has rallied by almost 10% since the plunge to a nine-and-a-half year low of 1.2874 in August, retracing more than half of its 2022 downtrend. On Tuesday the price accelerated above a bullish channel to mark a new higher high at 1.4125, but it soon lost momentum to close below the 61.8% Fibonacci retracement of the 2022 downtrend.  With the stochastics showing bearish divergence and the RSI having reached its 2020 top in the overbought territory, a downside correction looks increasingly [..]

Technical Analysis – USDJPY lacks bullish motives near November’s low

Posted on November 30, 2022 at 8:54 am GMT

USDJPY shifted to the sidelines following last week’s aggressive downfall from the 142.00 area, consolidating its losses between 139.55 and 137.49. Even though the pair is searching for a foothold near November’s low of 137.49, the technical signals have yet to identify strong buying motives. Particularly, the RSI has been struggling to gain ground following the exit from the oversold territory, while the MACD has been flattening slightly below its red signal line and within the negative area. If selling pressures [..]

Technical Analysis – NZDUSD consolidates after the 200-day SMA rejects advance

Posted on November 30, 2022 at 8:16 am GMT

NZDUSD has been trending lower since March, generating a profound structure of lower highs and lower lows. Even though the pair has posted a moderate recovery after finding its feet at the 30-month low of 0.5510, the 200-day simple moving average (SMA) has curbed further advances. The momentum indicators suggest that bullish forces are subsiding. Specifically, the stochastic oscillator is descending after posting a bearish cross, while the MACD histogram has fallen below its red signal line but remains in the [..]

post-image

Technical Analysis – Netflix stock rangebound after completing golden cross

Posted on November 29, 2022 at 12:53 pm GMT

Netflix’s stock has been experiencing a very tough year, losing more than 60% of its value and generating a five-year low of 162.00. Nevertheless, the share price has staged a moderate rebound since May, with the recent golden cross between the 50- and 200-day simple moving averages (SMAs) endorsing a broader recovery. The short-term oscillators are indicating that bullish forces are subsiding. Specifically, the RSI is pointing downwards slightly above its 50-neutral mark, while the MACD histogram has retreated below [..]

post-image

Technical Analysis – Copper futures rotate higher, but caution remains

Posted on November 29, 2022 at 12:08 pm GMT

Copper futures (March delivery) rotated northwards after marking a new monthly low at 3.545, but downside risks linger in the background as China’s zero-covid policies weigh on industrial metals’ outlook. Technically, a bullish bias has yet to be confirmed in the four-hour chart as the price keeps fluctuating below the 3.682-3.700 resistance zone. Note that the 38.2% Fibonacci retracement of the latest downfall is positioned in the same area. The momentum indicators are also reflecting some skepticism among traders as the stochastics [..]

post-image

Technical Analysis – AUDUSD jumps higher above short-term SMAs

Posted on November 29, 2022 at 9:36 am GMT

AUDUSD has been recording a stunning rally over the last three 4-hour sessions, surpassing the short-term simple moving averages (SMAs). The technical indicators suggest that the market could boost the upward move a little bit more in the near-term. The RSI is currently increasing positive momentum above its neutral threshold of 50 after an exit from negative levels, while the stochastic is keep moving higher after the bullish cross within the %K and %D lines. Should the market extend its gains, [..]

Technical Analysis – GBPUSD needs break above 200-SMA

Posted on November 29, 2022 at 8:59 am GMT

GBPUSD finished Monday’s session on the negative side, unable to climb above the 200-day simple moving average (SMA) at 1.2145 once again; the line has been acting as a crucial ceiling to upside movements since September 2021. The positive structure of higher highs and higher lows in the short-term picture remains valid, backed by the bullish cross between the 20- and 50-day SMAs. Encouragingly, the momentum indicators are still in favor of the bulls despite the latest retreat in the price. The RSI is [..]

post-image

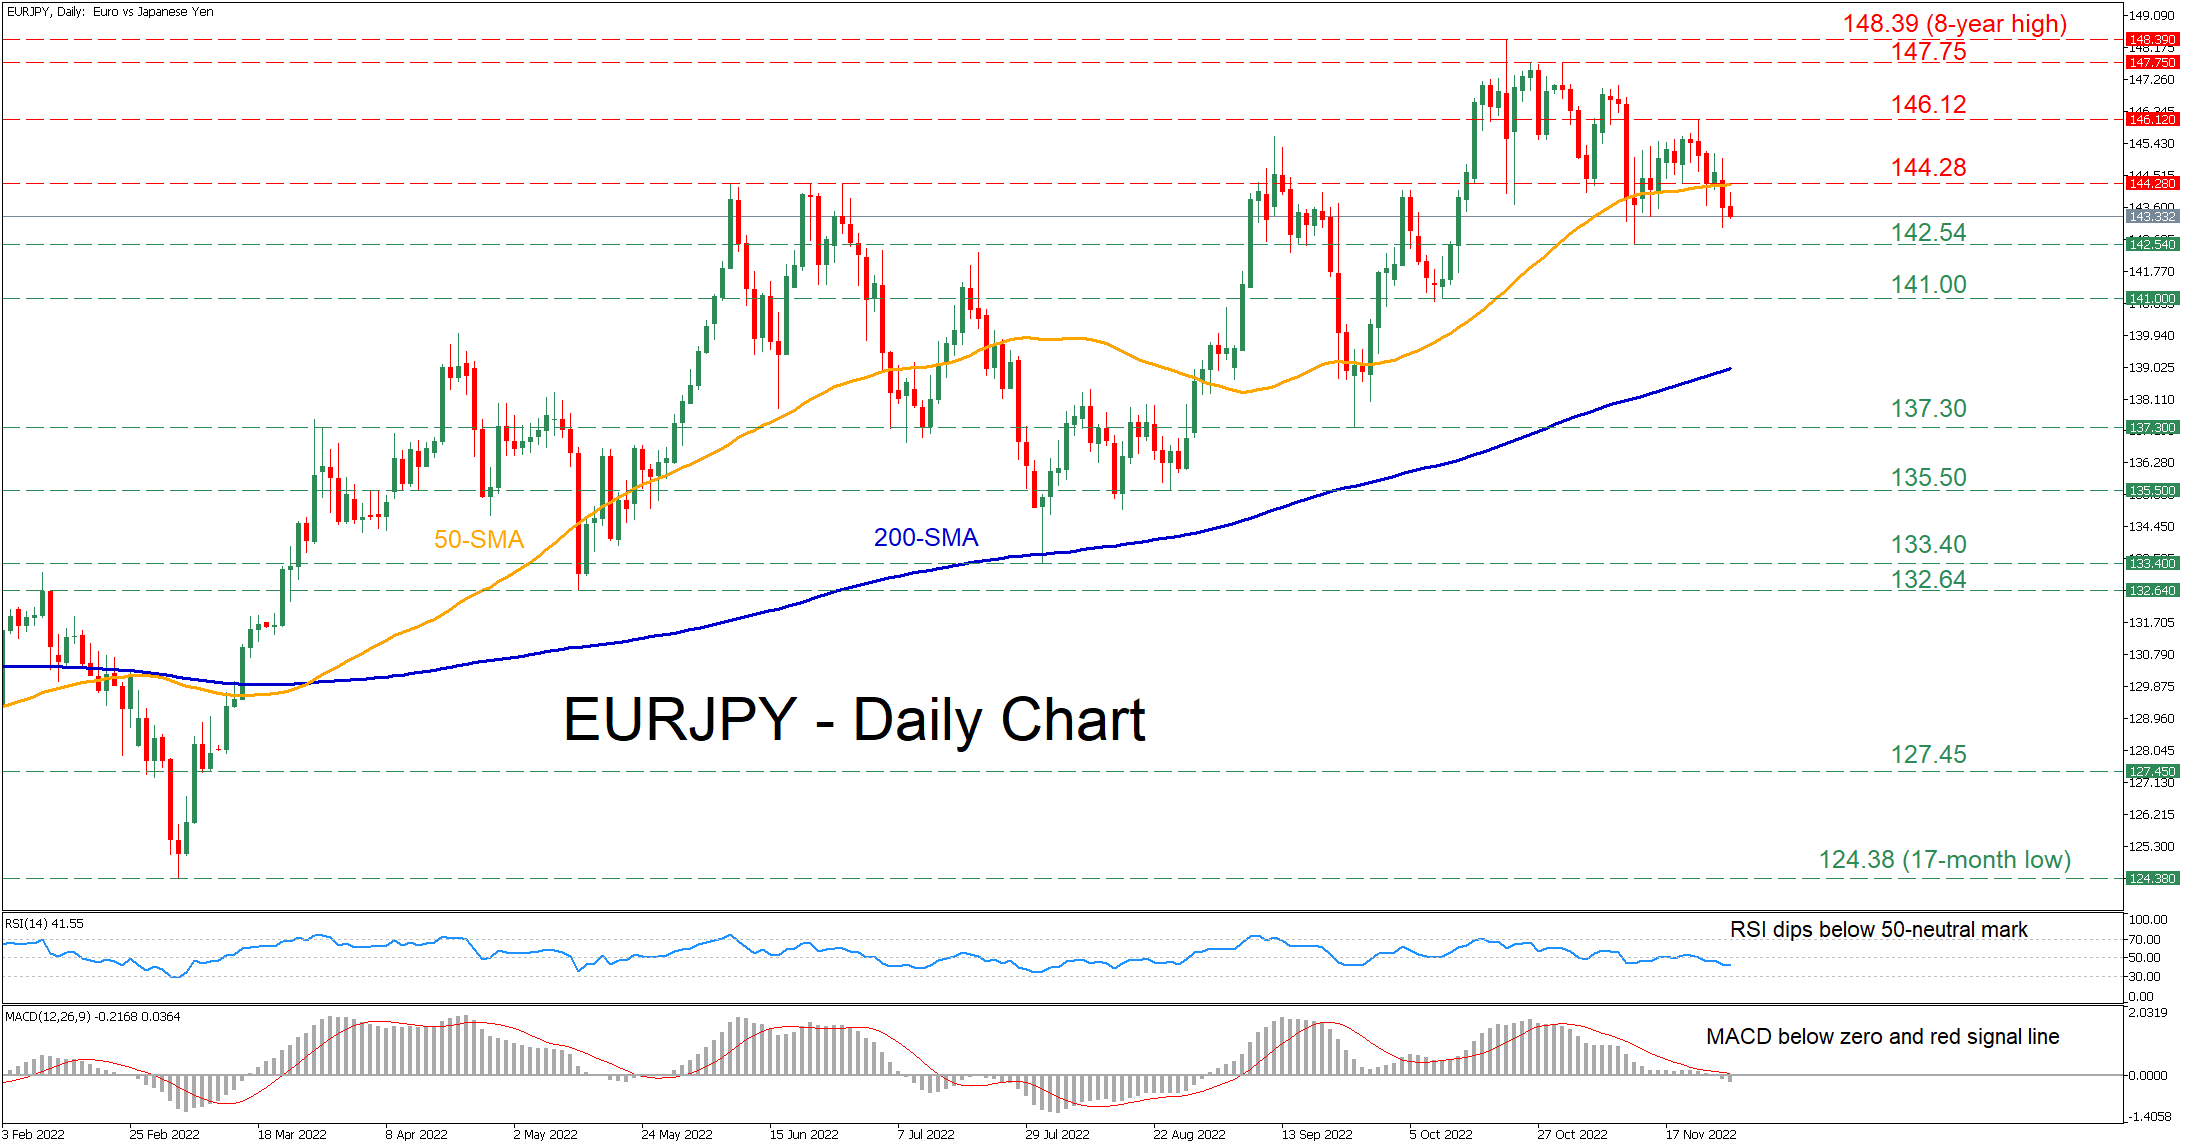
Technical Analysis – EURJPY retreats below 50-day SMA

Posted on November 29, 2022 at 8:24 am GMT

EURJPY has been in a prolonged uptrend since early March, generating consecutive multi-year peaks. However, the pair has been losing ground in the short term after its rally paused at the eight-year high of 148.39. The momentum indicators currently suggest that bearish forces are strengthening. Specifically, the RSI has crossed below its 50-neutral mark, while the MACD histogram is retreating further below both zero and its red signal line. If sellers push the price lower, initial support could be met at the recent [..]

post-image

Technical Analysis – EURCHF ascends sharply but fails to breach recent resistance

Posted on November 28, 2022 at 3:31 pm GMT

EURCHF has been trending higher in the last few four-hour sessions, generating consecutive higher highs. Even though the pair crossed forcefully above both its 50- and 200-period simple moving averages (SMAs), it got rejected at the mid-November peak of 0.9889. The momentum indicators currently suggest that bullish forces are intensifying. Specifically, the stochastic oscillator is sloping upwards after posting a bullish cross in the oversold zone, while the MACD histogram is strengthening above both zero and its red signal line. [..]

post-image

Technical Analysis – USDJPY oversold near November’s lows; risks remain

Posted on November 28, 2022 at 3:30 pm GMT

USDJPY paused its latest decline near November’s low of 137.66 before climbing back into the 138.00 territory on Monday. The RSI and the stochastics on the four-hour chart are flagging oversold conditions, justifying the latest bullish correction in the price. However, the way higher could be rocky, as several obstacles remain intact. The 20-period simple moving average (SMA) could postpone an extension to the 50-period SMA at 140.00. Above the latter, the pair may get congested within the 141.35–142.00 territory formed by two [..]

Risk Warning: Your capital is at risk. Leveraged products may not be suitable for everyone. Please consider our Risk Disclosure.