XM does not provide services to residents of the United States of America.

Technical Analysis

post-image

Technical Analysis – Dollar index hovers near 5-month low with strong negative momentum

Posted on December 14, 2022 at 11:14 am GMT

The dollar index dived to a fresh five-month low of 103.50 on Tuesday, retaining the selling interest that started from the 20-year peak of 114.70. Looking at momentum oscillators on the daily chart, they suggest further declines may be on the cards in the short-term. The RSI is below its neutral 50 line, detecting negative momentum, and is also pointing downwards. The MACD, already negative, lies below its trigger line. Should prices decline further, immediate support could be found around [..]

post-image

Technical Analysis – EURGBP trades in a sideways manner

Posted on December 14, 2022 at 10:37 am GMT

EURGBP has been trading in a quiet mode since Friday, hovering slightly above the 0.8545/70 zone, which has been providing strong support since September. That area is also acting as the lower bound of a sideways range the pair has been trading in since early October, with the upper bound being at 0.8825. This, combined with the fact that all three of the plotted moving averages point sideways, paints a neutral picture for now. Adding to the trendless narrative are [..]

Technical Analysis – NZDUSD eases after the rally to 6-month high

Posted on December 14, 2022 at 9:32 am GMT

NZDUSD continued the impressive rally that started after the bounce off the 31-month low of 0.5510 during yesterday’s session, surging towards a new six-month peak of 0.6512. The pair penetrated the medium-term downtrend line to the upside in the preceding sessions, creating a steep short-term ascending trend line. However, the MACD oscillator is moving sideways mirroring the downside retracement from the aforementioned high and today’s negative reaction, while the RSI is pointing slightly down near the overbought region. In the event of [..]

post-image

Technical Analysis – Gold consolidates after move higher but momentum indicators are not encouraging

Posted on December 14, 2022 at 9:24 am GMT

Gold is consolidating following yesterday’s potent move higher on the back of economic developments. It printed the highest level since June 29 at 1,824, continuing the recent trend of higher highs. The medium-term trend remains bullish, also supported by the 50-, 100- and 200-day simple moving averages (SMA) sloping upwards, and the ascending November 29 trendline.  However, the momentum indicators do not seem overly impressed. The ADX edged above the 25 threshold but the respective sub-components, D+ and D-, continue [..]

Technical Analysis – USDJPY unable to break below 200-day SMA

Posted on December 14, 2022 at 8:29 am GMT

USDJPY has been in a prolonged uptrend for almost two years, crossing above its historical resistance levels to post a 32-year high of 151.94 in October. However, the pair has declined moderately from its recent multi-year peak, with the 200-day simple moving average (SMA) currently acting as a strong floor. The momentum indicators currently suggest that bearish forces are in control. Specifically, the RSI is hovering below its 50-neutral mark, while the stochastic oscillator is descending after posting a bearish cross. If sellers eventually [..]

post-image

Technical Analysis – US 100 index edges higher but bias unclear

Posted on December 13, 2022 at 9:40 am GMT

The US 100 cash index has been edging slightly higher in the past few sessions, mirroring other stock market indices ahead of this week’s main events. The US 100 remains confined within its recent range, with the 23.6% Fibonacci retracement level of the November 22, 2021 – October 13 downtrend of 11,926 and the 100-day simple moving average (SMA) respectively defining the upside boundary. Similarly, the lower boundary is established by the 50-day SMA and the January 4 downward sloping trendline. Both the RSI [..]

Technical Analysis – GBPUSD remains muted ahead of CPI reports

Posted on December 13, 2022 at 8:17 am GMT

GBPUSD has been attempting a strong rebound after finding its feet at the all-time low of 1.0324 in late September. Even though the pair managed to cross above the crucial 200-day simple moving average (SMA), its advance has come to a halt ahead of the crucial US and UK inflation prints later this week. The short-term oscillators are currently indicating a bullish near-term tone. Specifically, the RSI is hovering above its 50-neutral mark, while the stochastic oscillator is ascending after posting [..]

post-image

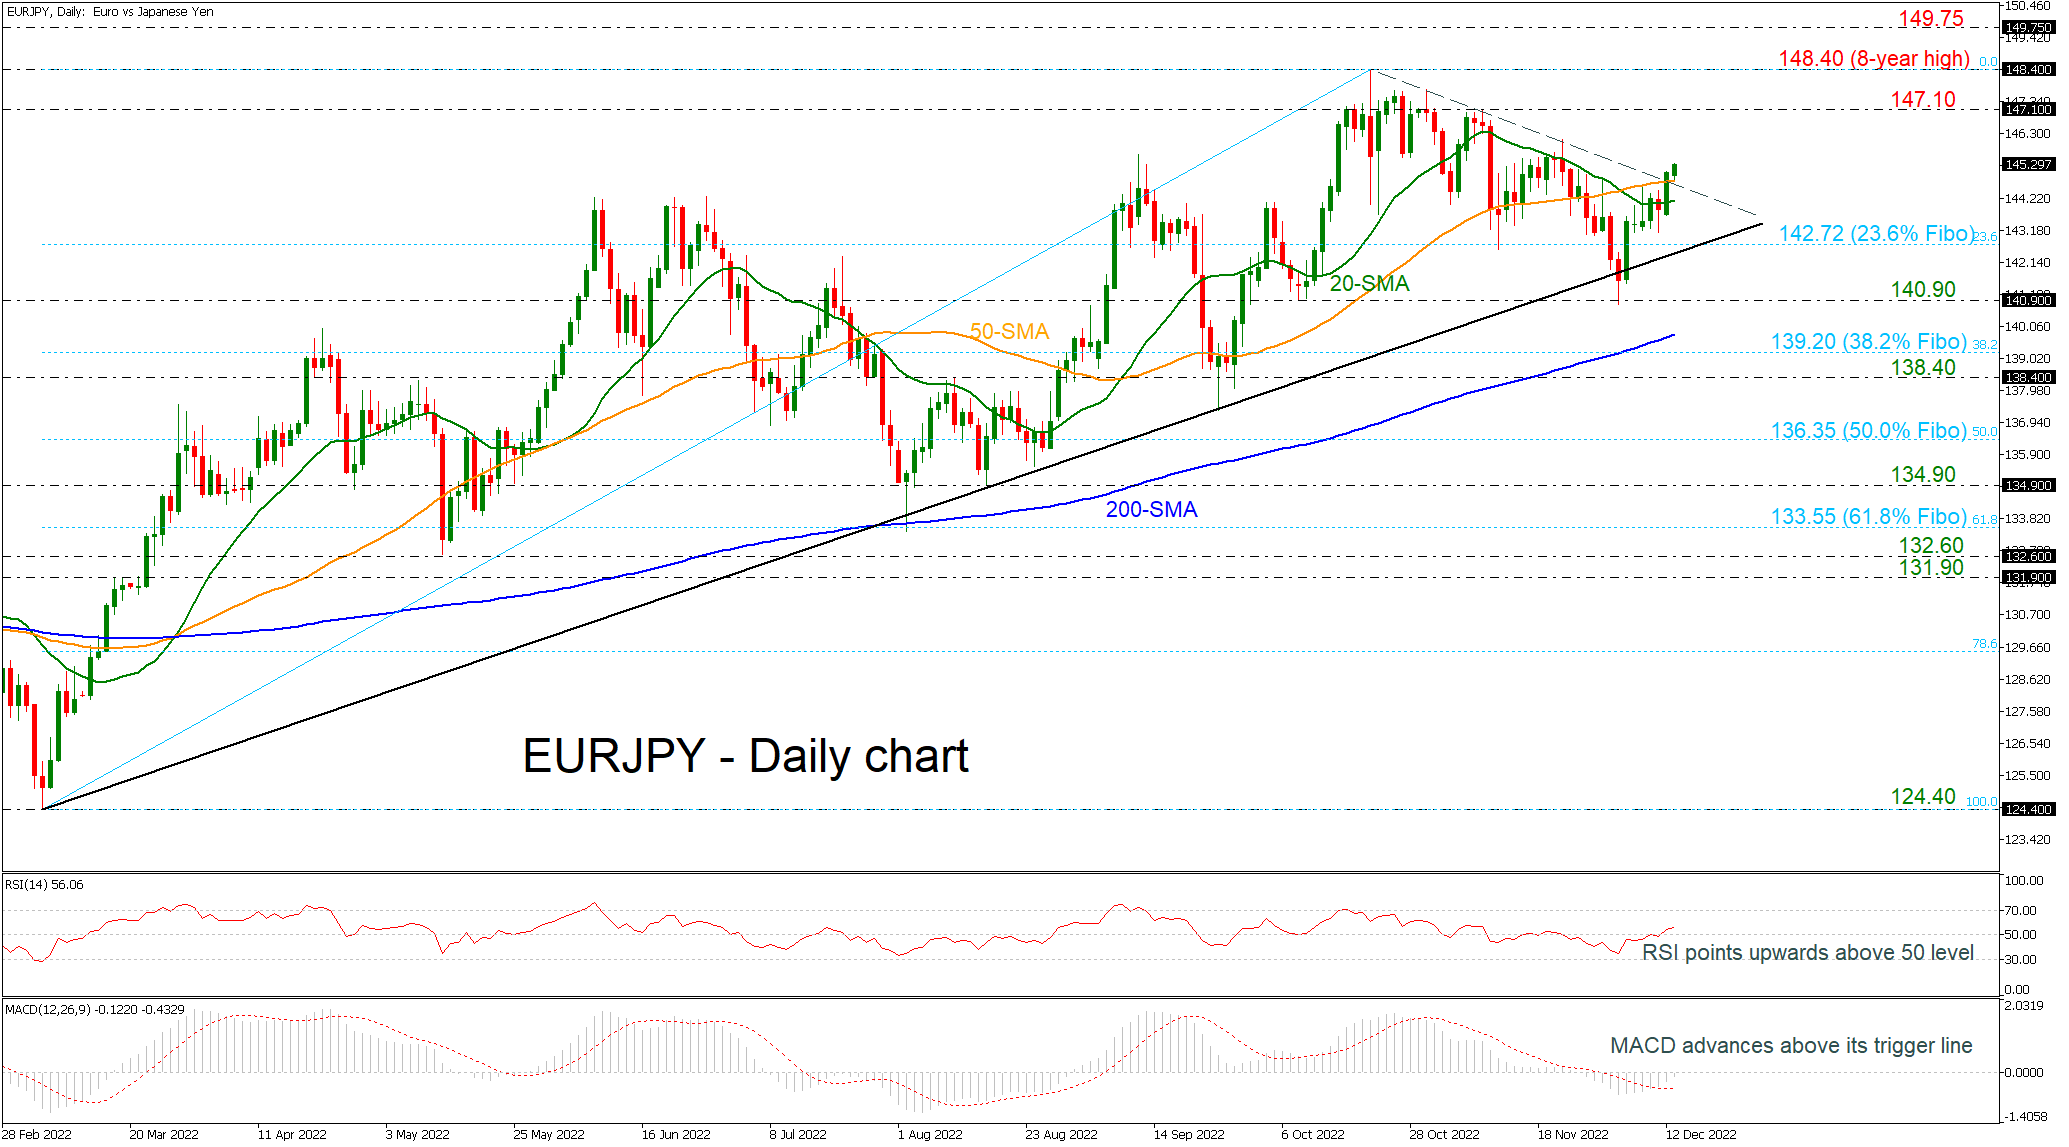
Technical Analysis – EURJPY poised for more recovery above near-term uptrend line

Posted on December 13, 2022 at 7:40 am GMT

EURJPY is surging above the short-term simple moving averages (SMAs) after the strong rebound off the 140.90 support level and the long-term ascending trend line. The pair is currently penetrating the near-term downtrend line to the upside, suggesting that the broader bullish outlook will continue again.   The technical oscillators are mirroring this upside move as the RSI is pointing north above the neutral threshold of 50, while the MACD is surpassing its trigger line, but it is still beneath [..]

post-image

Technical Analysis – US 500 index trades sideways but increasing evidence for bearish move

Posted on December 12, 2022 at 9:59 am GMT

The US 500 cash index is trading sideways amidst an action-packed week. The Fed-induced rally on November 30 has been completely unwound, as the index currently finds support at the 100-day simple moving average (SMA). The sideways move has support from the directionless Average Directional Movement Index (ADX) and the RSI floating around the 50-midpoint. Should the bulls decide to take over the market, the initial targets would be the 38.2% Fibonacci retracement level of the January 5 – October [..]

post-image

Technical Analysis – USDJPY cannot cement bullish case

Posted on December 12, 2022 at 8:59 am GMT

USDJPY faced new hurdles near the 137.00 level early on Monday, immediately after stepping above the resistance trendline that has been keeping the bulls under control for almost a month. While the gentle bullish trendline breakout raised hopes for a continuation higher, the momentum indicators on the four-hour chart signal there is no solid bullish case as the RSI has yet to show a convincing movement above its 50 neutral mark. Moreover, the MACD remains muted around its red signal and [..]

Risk Warning: Your capital is at risk. Leveraged products may not be suitable for everyone. Please consider our Risk Disclosure.