XM does not provide services to residents of the United States of America.

Technical Analysis

post-image

Technical Analysis – Intel: A break above 31.27 is key for short-term momentum

Posted on January 26, 2023 at 10:45 am GMT

Intel stock settled yesterday at 29.64, just below the recent high of 31.27. It has been a brutal 18-month period for the stock until the bulls finally managed to stage strong support at the 24.63-25.29 area during the fourth quarter of 2022. These levels are the basis for the formed double bottom pattern that appears to be affecting the price action.  Historically, this type of structure is considered a significant reversal pattern, but prone to false breakouts. The key level remains [..]

post-image

Technical Analysis – Visa stock remains bullish ahead of earnings

Posted on January 26, 2023 at 9:29 am GMT

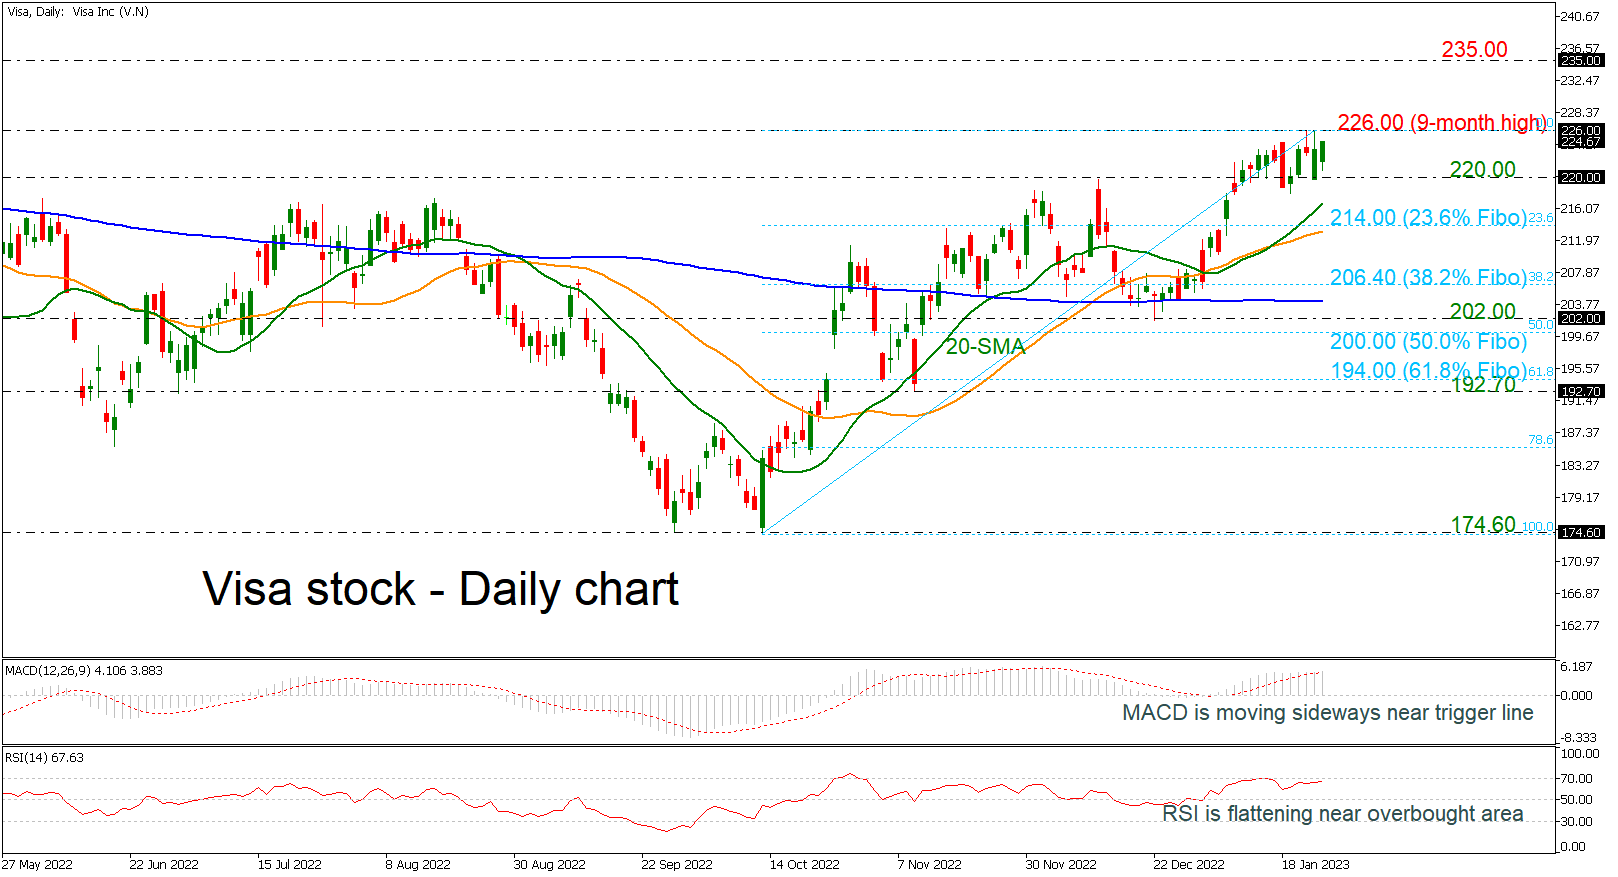
Visa stock is experiencing some gains above 220.00 support level and is moving towards the nine-month high of 226.00 before the earnings release later today. The MACD oscillator is trying to gain momentum above its trigger line in the positive area, while the RSI is flattening near the overbought territory, indicating that the next move may be to the downside rather to the upside. More gains could lead the stock price towards the immediate nine-month high of 226.00 before moving towards the [..]

Technical Analysis – USDJPY trapped within bearish area; support at 129

Posted on January 26, 2023 at 8:50 am GMT

USDJPY faced another rejection at the topline of the four-month-old downward-sloping channel near 131.11, increasing speculation that a new selling wave could start in the short term. The 20-day simple moving average (SMA) was another hurdle. Monday’s low of 129.00 is currently buffering downside pressures, though the technical signals remain confusing, providing little hope for a bullish breakout. Despite its latest rebound, the RSI keeps hovering within a range below its 50 neutral mark. The stochastic oscillator looks set for a negative [..]

Technical Analysis – WTI oil futures consolidate above 50-day SMA

Posted on January 26, 2023 at 8:25 am GMT

WTI oil futures (March delivery) have been stuck in a prolonged downtrend since June, generating a fresh one year-low of 70.30 in December. Even though the commodity managed to recoup some losses and break above its 50-day simple moving average (SMA), its rebound seems to be running out of juice. The momentum indicators currently suggest that near-term risks are tilted to the upside. Specifically, the MACD histogram is softening but remains above zero and its red signal line, while the RSI is flatlining [..]

post-image

Technical Analysis – Tesla’s pickup takes a breather ahead of earnings

Posted on January 25, 2023 at 12:13 pm GMT

Tesla’s stock switched into gains in January after its downtrend halted at a 27-month low of 101.00. Although the stock is trading far below its 2021 record high, and a trend reversal could be a long way away, the clear pickup above the 50-period simple moving average (SMA) in the four-hour chart, which was the first since August, is promoting a continuation higher. The line’s bullish crossover with the 20-period SMA is also an encouraging sign, but needs a confirmation. A consolidation phase [..]

post-image

Technical Analysis – Could Boeing test the recent high?

Posted on January 25, 2023 at 11:11 am GMT

Boeing stock settled yesterday at 211.6, just below the recent high of 216.33. This recent small pullback could be perceived as positive by the stock bulls considering the aggressive move the stock has recorded since October 3, when it traded at 120.59. This upward move appears to be the product of the double bottom pattern formed during 2022, which, based on historical performance, suggests a target price of 235. However, only 75% of this pattern type achieve their target. In addition, [..]

Technical Analysis – USDCAD bears seek dominance as BoC rate decision looms

Posted on January 25, 2023 at 8:43 am GMT

USDCAD has been moving sideways over the past two weeks, building a floor around 1.3370, but the bears seem determined to lead their market on their own way ahead of the BoC rate decision today at 15:00 GMT. With the RSI pulling below its 50 neutral mark and the MACD sliding back below its red signal line within the negative area, downside moves are more likely than upside ones in the coming sessions. The stochastic oscillator is also on a decline, though [..]

Technical analysis – NZDUSD faces tough challenge near 7-month high

Posted on January 25, 2023 at 8:23 am GMT

NZDUSD had experienced a steep downtrend in 2022, posting a 31-month low of 0.5510 in early October. However, the pair has staged a substantial rebound since then, which seems to be running out of steam slightly below the recent seven-month high of 0.6528. The momentum indicators currently suggest that buying forces are subsiding but remain in control. Specifically, the RSI is pointing downwards above its 50-neutral mark, while the MACD histogram is softening but holds above both zero and its red signal line. [..]

post-image

Technical Analysis – EURGBP gains momentum; tries to shift the outlook to strongly bullish

Posted on January 25, 2023 at 8:01 am GMT

EURGBP is recording the fifth straight green day, following the rebound off the 0.8720 support and the 50-day simple moving average (SMA). The price jumped above the 20-day SMA as well and is approaching a crucial resistance at 0.8895. Technically, the RSI is heading north above the neutral threshold of 50, while the MACD is strengthening its positive momentum above the zero line but is still below its trigger level. If buyers push above the 0.8895 barrier, initial resistance could [..]

post-image

Technical Analysis – J&J opens with a positive gap, but outlook remains gloomy

Posted on January 24, 2023 at 3:13 pm GMT

The Johnson & Johnson stock opened with a positive gap on Tuesday, after the firm forecasted annual profit above Wall Street’s estimates. However, the share price was quick to cover that gap and hit support slightly above the key territory of 167.00. Overall, since the break below 175.00, J&J has been in a downtrend mode and thus, further declines cannot be ruled out. The RSI has fallen fractionally below 30, while the MACD is running below both its zero and trigger [..]

Risk Warning: Your capital is at risk. Leveraged products may not be suitable for everyone. Please consider our Risk Disclosure.