XM does not provide services to residents of the United States of America.

Technical Analysis

post-image

Technical Analysis – USDCHF dives beneath short-term SMAs

Posted on March 17, 2023 at 8:07 am GMT

USDCHF is falling further after the strong buying interest on Wednesday. The pair is heading beneath the 20- and the 50-day simple moving averages (SMAs) while the technical oscillators are endorsing the negative structure. The RSI is pointing down from the neutral threshold of 50 and the MACD oscillator is moving sideways below its trigger and zero lines. Should the market extend losses, support could be met between the 0.9070 support and the 0.9020 barrier, registered in August 2021. A [..]

post-image

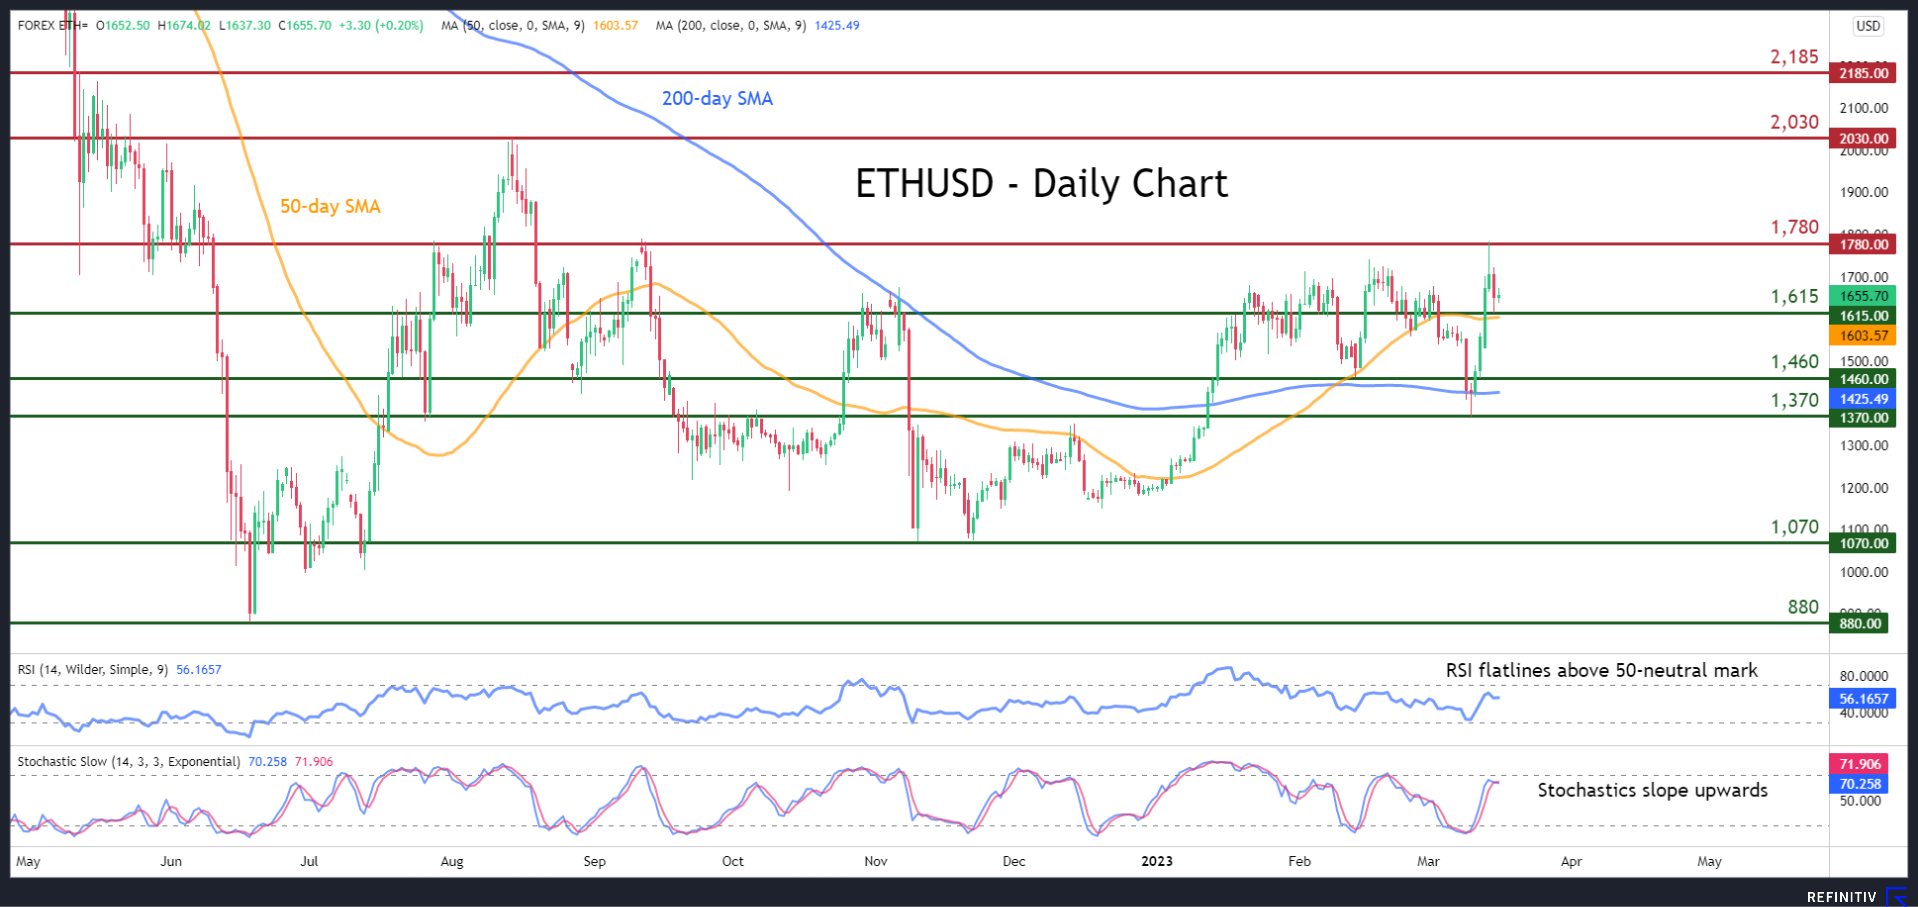
Technical Analysis – ETHUSD retraces lower after posting fresh 6-month high

Posted on March 16, 2023 at 1:11 pm GMT

ETHUSD (Ethereum) experienced a significant correction after its 2023 rally stalled around the 1,740 zone in mid-February. However, the digital asset managed to stage a solid comeback, generating a fresh six-month high of 1,780 before paring some gains. The momentum indicators currently suggest that the bullish forces are in control. Specifically, the stochastic oscillator is ascending, while the RSI has flatlined above its 50-neutral mark. If the price edges higher, the recent six-month peak of 1,780 could act as initial resistance. Conquering this [..]

post-image

Technical Analysis – Brent futures recoup losses after losing more than 13%

Posted on March 16, 2023 at 12:58 pm GMT

Brent crude oil lost more than 13% in the preceding three trading sessions, recording a fresh 15-month low of 71.66. Currently, the market is rising slightly but the tendency is bearish after the break below 75.60. The RSI indicator is moving sideways near the oversold region, while the MACD is extending its negative structure beneath its trigger and zero lines.     Should prices decline, immediate support could be found around the 69.30 barrier, taken from the lows in November 2021, [..]

post-image

Technical Analysis –JP225 cash index tries to recover some recent losses

Posted on March 16, 2023 at 9:44 am GMT

The JP225 cash index is staging a small comeback today following five consecutive negative sessions amidst the wider market developments that pushed it around 8% lower from the March 9 high. It is currently battling with the 50% Fibonacci retracement level of the March 8, 2022 – August 17, 2022 uptrend of 26,866, the midpoint of the very wide range that the index has been trading since March 2022. The large moves might actually not be over considering the current convergence [..]

Technical Analysis – WTI oil futures resume bearish outlook

Posted on March 16, 2023 at 9:05 am GMT

WTI oil futures collapsed to a 15-month low of 65.68 on Wednesday after breaking the four-month-old range below the 72.65 floor. The price, however, managed to close around the 50% Fibonacci retracement of the 2020-2021 rally at 68.35, increasing the odds for an upside correction or some stabilization as the RSI and the Stochastic oscillator hover near oversold levels. Yet, the decline in the indicators has not ceased yet, suggesting the downside pressures may dominate for a bit longer before the [..]

Technical Analysis – AUDUSD pauses decline but bearish pattern remains intact

Posted on March 16, 2023 at 8:43 am GMT

AUDUSD had been in a prolonged uptrend since mid-October, generating a clear structure of higher highs and higher lows. Nevertheless, the pair has been experiencing a significant downside correction in the short term, with the price trading within a downward sloping channel after peaking at 0.7157. The momentum indicators currently suggest that bearish forces are waning but remain in control. Specifically, the MACD histogram has jumped above its red signal line but remains in the negative territory, while the RSI is pointing upwards [..]

post-image

Technical Analysis – EURUSD shows positive signs after strong selling interest

Posted on March 16, 2023 at 8:16 am GMT

EURUSD is recouping some of the aggressive losses that it posted on Wednesday, adding almost 1% after the rebound off the 1.0530 support, which is overlapping with the 200-period exponential moving average (SMA) in the daily timeframe. However, the technical oscillators in the 4-hour chart are suggesting a potential recovery. The RSI is rising in the bearish region, while the MACD is still in the negative region, although it appears to have halted its decline. Should the pair manage to strengthen its positive momentum, [..]

post-image

US500 cash index: Top-down Technical Analysis – Special Report  

Posted on March 15, 2023 at 3:49 pm GMT

During tumultuous times like the current post-SVB collapse period, the top-down technical analysis could be the compass for market investors/traders. Focusing on multiple timeframes can protect from decisions based purely on the very short-term periods examined. This process tends to be more time-consuming and understandably most traders ignore it, but the benefits clearly outweigh the negatives. In this report we analyse the US500 cash index, which along with other stock indices continues to feel the banking sector aftershocks, starting from [..]

post-image

Technical Analysis – EURGBP at risk of breaking below sideways range

Posted on March 15, 2023 at 3:19 pm GMT

EURGBP has mostly been trading between the 23.6% and 50% Fibonacci retracement levels of the September-December 2022 downtrend over the past three months, but the lower bound of that range came under attack on Wednesday. Sellers swarmed into the market after the 20- and 50-day simple moving averages (SMA) caved in on the price. The 20-day SMA is in the process of crossing below the 50-day one, while the Tenkan-sen and Kijun-sen lines of the Ichimoku cloud are sloping downwards [..]

post-image

Technical Analysis – Gold spikes higher as uncertainty floods markets

Posted on March 15, 2023 at 1:51 pm GMT

Gold has been in an uptrend in the four-hour chart, which temporarily paused near the 1,914 territory. However, gold spiked higher as markets turned pessimistic over Credit Suisse’s solvency, while technically, the ascending 50-period period moving average (SMA) is positively closing the gap with the 200-period SMA. The momentum indicators are endorsing this bullish breakout. Specifically, the RSI is ascending sharply within the overbought zone, while the stochastic oscillator is sloping upwards after posting a bullish cross. Should gold extend [..]

Risk Warning: Your capital is at risk. Leveraged products may not be suitable for everyone. Please consider our Risk Disclosure.