XM does not provide services to residents of the United States of America.

Technical Analysis

post-image

Technical Analysis – Meta stock fragile ahead of earnings

Posted on April 26, 2023 at 3:34 pm GMT

Facebook’s stock (Meta platforms) closed below the 50-period simple moving average (SMA) in the four-hour for the first time since November 2022, increasing the risk for a bearish continuation ahead of the company’s earnings due today after the closing bell. While the price attempted to bounce from the one-month low of 206.10 earlier today, the channel’s broken lower trendline came to block the way near 212. The momentum indicators have not shown significant improvement either, with the RSI remaining below [..]

post-image

Technical Analysis – CHFJPY storms to a fresh all-time high

Posted on April 26, 2023 at 2:51 pm GMT

CHFJPY experienced a significant downtrend after peaking at its previous record high of 151.41 in September 2022. However, the pair managed to rebound strongly from its 2023 bottom, posting a fresh all-time high of 151.51 last Tuesday before paring some gains. The momentum indicators currently suggest that bullish pressures are fading but retain control. Specifically, the stochastic oscillator is descending after posting a bearish cross, while the RSI exited its overbought zone but remains way above its 50-neutral mark. Should buyers [..]

post-image

Technical Analysis – Gold stuck in rangebound pattern, capped by 50-SMA

Posted on April 26, 2023 at 9:08 am GMT

Gold experienced a moderate pullback after peaking at the 13-month high of 2,048 in mid-April. Since then, the price has been trading without a clear direction within a rectangle pattern, while the congested region that includes the 50-period simple moving average (SMA) and the lower bound of the Ichimoku cloud has repeatedly curbed upside efforts. The momentum indicators currently suggest that the bullish forces are subsiding. Specifically, the stochastic oscillator is set to post a bearish cross, while the RSI is losing [..]

Technical Analysis – USDJPY challenges April’s bullish trend

Posted on April 26, 2023 at 8:03 am GMT

USDJPY has been in a slow corrective mode below the 135.00 area so far this week, making investors wonder whether this is another temporary bearish phase within the short-term uptrend. Although the price is currently seeking new support from its simple moving averages (SMAs) within the 133.75-133.45 region and near its previous highs, the momentum indicators are not looking promising. The RSI has almost erased its latest bounce and is approaching its 50 neutral mark. Likewise, the MACD has lost some ground [..]

Technical Analysis – NZDUSD fails to jump above the 200-day SMA

Posted on April 26, 2023 at 7:41 am GMT

NZDUSD is still developing beneath the strong flat 200-day simple moving average (SMA) around the 0.6155 barrier. The RSI indicator is standing beneath its trigger and zero lines with weak momentum, while the MACD is losing ground beneath its trigger and zero lines. An extension of the bearish movement may find immediate support at the three-and-half-month low of 0.6080. Even lower, the 0.6000 psychological mark may halt the negative actions but if not the 0.5840 obstacle may act as a [..]

post-image

Technical Analysis – Mastercard bears might have a chance to recoup recent losses

Posted on April 25, 2023 at 2:35 pm GMT

Mastercard is hovering around the 373 area today as the market prepares for the key earnings releases. The bulls tried to record a new high for 2023, but the rally halted on April 24 at 377.17, breaking the recent series of higher highs and higher lows. The negative news for the bulls doesn’t stop here as the momentum indicators are pointing to a potential reversal of the recent rally.  The Average Directional Movement index (ADX) is turning lower from a 6-month high and [..]

post-image

Technical Analysis – EURGBP pokes its nose above 0.8865

Posted on April 25, 2023 at 1:59 pm GMT

EURGBP has been edging north since April 19 when it hit support slightly above the 100-day exponential moving average (EMA). The pair is trading above all three of the plotted EMAs, as well as above the uptrend line drawn from the low of August 3, which paints a positive medium-term picture. Our short-term oscillators make the outlook even brighter. The RSI moved higher after rebounding from its 50 line, while the MACD lies above both its zero and trigger lines, [..]

post-image

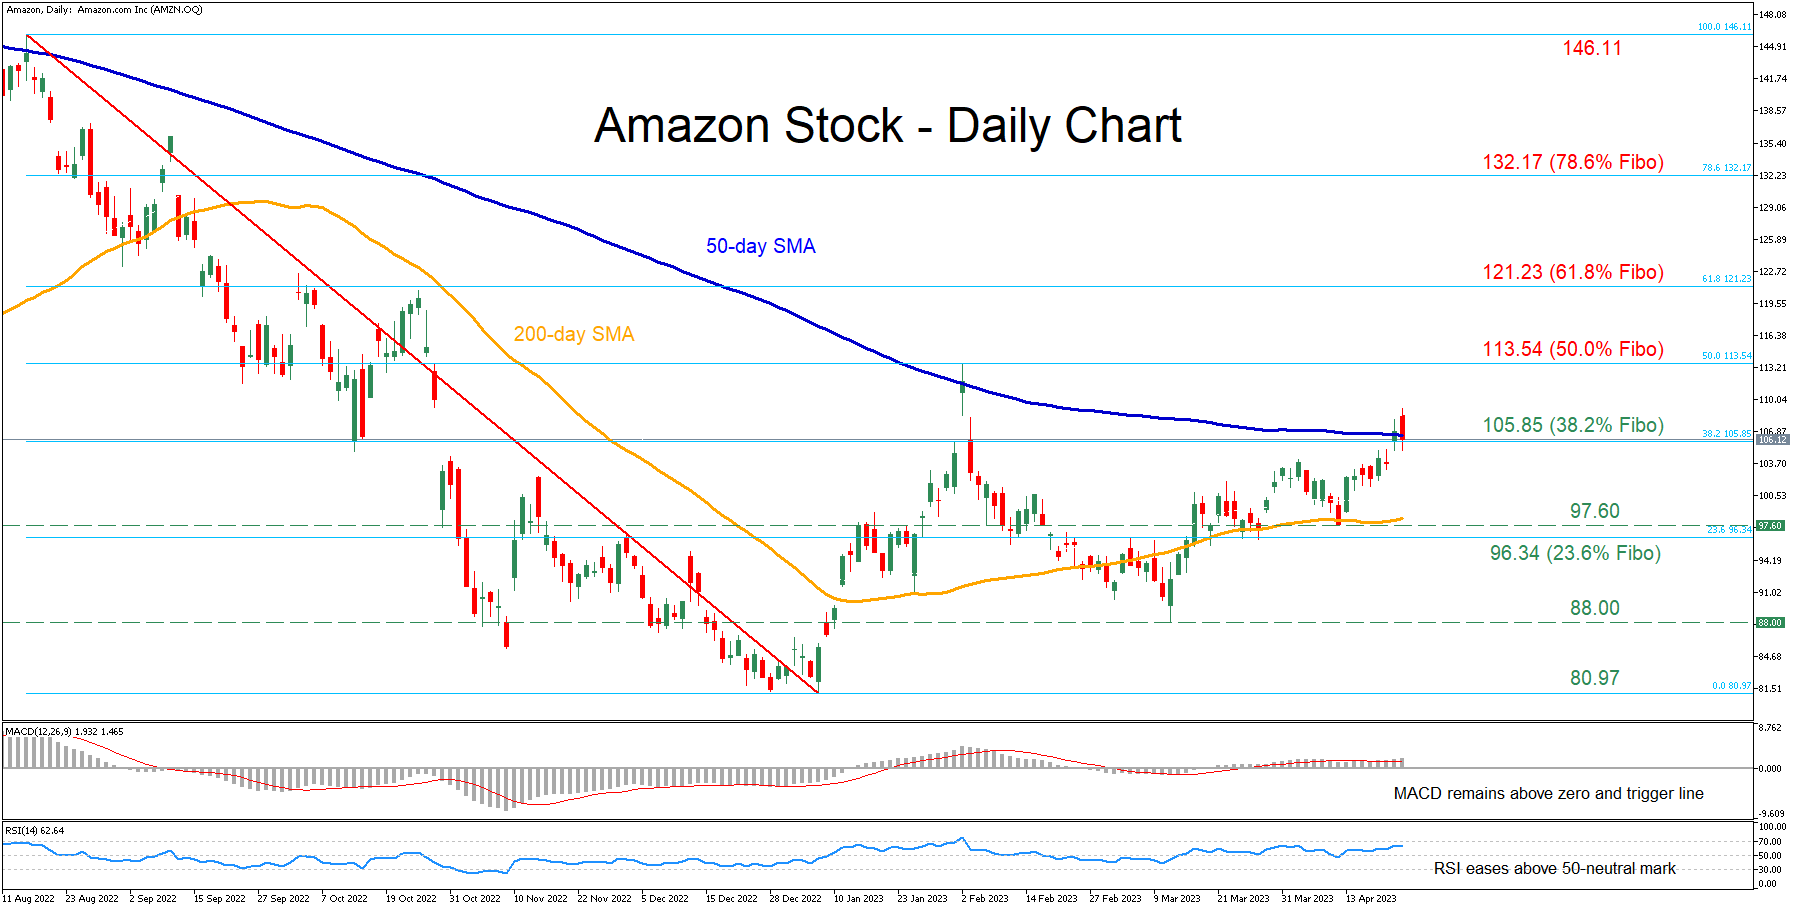
Technical Analysis– Amazon stock pauses advance at 200-day SMA ahead of earnings

Posted on April 25, 2023 at 1:45 pm GMT

Amazon’s stock has been on a steady uptrend after encountering strong support in mid-March. However, the recent rally has temporarily stalled as the price has been battling with the 200-day simple moving average (SMA) in the last couple of daily sessions. Even though the short-term oscillators reflect a slight loss of positive momentum, near-term risks remain tilted to the upside. Specifically, the RSI is flatlining above its 50-neutral mark, while the MACD histogram is softening but holding above both zero and its [..]

post-image

Technical Analysis – Intel back inside the rectangle; bearish tendencies intensify

Posted on April 25, 2023 at 12:40 pm GMT

Intel stock settled yesterday at 29.60, below the 200-day simple moving average (SMA) for the first time since March 29. Actually, the stock has been trading inside a tight 24.63-31.27 rectangle that has formed since September 2, 2022 with the early April upside breakout proving to be a false one. History suggests a retest of the rectangle lows, which coincides with the message conveyed by the momentum indicators. The Average Directional Movement Index (ADX) has returned above the 25-threshold as the [..]

post-image

Technical Analysis – AUDUSD slips notably below 200-period SMA

Posted on April 25, 2023 at 9:25 am GMT

AUDUSD has come under renewed selling pressure, falling back below its 200-period simple moving average (SMA). Despite the latest pullback though, the pair has not posted a fresh lower low, which makes one hesitant to trust further declines for now. Looking at momentum oscillators on the 4-hour chart, they suggest further declines may be on the cards in the short term. The RSI is below its neutral 50 line, detecting negative momentum, and is also pointing downwards. The MACD, already [..]

Risk Warning: Your capital is at risk. Leveraged products may not be suitable for everyone. Please consider our Risk Disclosure.