XM does not provide services to residents of the United States of America.

Technical Analysis

Technical Analysis – USDJPY aims to revive 2023 uptrend

Posted on May 17, 2023 at 7:39 am GMT

USDJPY has been in the green for almost a week, aiming to resume its 2023 uptrend above the key 137.50-138.00 resistance territory. The technical picture suggests there is more room for improvement. The exponential moving averages (EMAs) remain positively aligned, with the price trading above those lines. Moreover, the RSI and the MACD are sloping upwards in the bullish area, reflecting a bullish bias too. The stochastic oscillator, though, is already in the overbought region. Therefore, some caution might be necessary as the price is [..]

Technical analysis – NZDUSD battles with 50-day SMA after decline pauses

Posted on May 17, 2023 at 7:31 am GMT

NZDUSD was in a steady short-term uptrend, posting a fresh three-month high of 0.6383 before experiencing a significant pullback. Although the pair managed to halt its retreat and recoup some losses, its attempt for a recovery stalled at the congested region that includes the 50-day simple moving average (SMA) and the lower end of the Ichimoku cloud. The momentum indicators are reflecting a loss of positive momentum. Specifically, the MACD dropped beneath its red signal line but remains above zero, while [..]

post-image

Technical Analysis – AUDUSD continues to trade in sideways manner

Posted on May 16, 2023 at 2:49 pm GMT

AUDUSD has been in a sliding mode this week, after hitting resistance near its 50-period exponential moving average (EMA). That said, in the bigger picture, the pair has been trading sideways since February 24, with most of the price action being contained between the 0.6625 and 0.6795 barriers. Therefore, the short-term outlook for now remains neutral. Both the short-term oscillators are detecting negative momentum. The RSI is lying below 50, but it has turned up today, while the MACD, although [..]

post-image

Technical Analysis – JP 225 index tops near channel’s upper band

Posted on May 16, 2023 at 11:31 am GMT

Japan’s 225 stock index (cash) flatlined near a 1½-year high of 29,918 and at the upper boundary of a bullish channel after a remarkable two-week rally. The RSI and the Stochastic oscillator in the four-hour chart seem to have peaked in the overbought region, flagging a potential downside reversal. The tiny candlesticks at the top of the uptrend could be another indication that the latest upswing is overdone. If the bears take charge below 29,840, the price may seek shelter somewhere between 29,650 and 29,540. The [..]

Technical Analysis – GBPUSD trapped between key barriers

Posted on May 16, 2023 at 7:48 am GMT

GBPUSD attempted to recover some lost ground on Monday after its pullback from the 2021 descending trendline stalled near 1.2442. Despite its latest bullish efforts, the pair could not overcome its 20-day simple moving average (SMA), which has been acting as resistance over the past three days around 1.2520. Given the falling MACD and the negative slope in the RSI, which is set to cross below its 50 neutral mark, the risk is tilted to the downside rather than the [..]

post-image

Technical Analysis – Amazon stock fails to advance above 2023 peak

Posted on May 16, 2023 at 7:26 am GMT

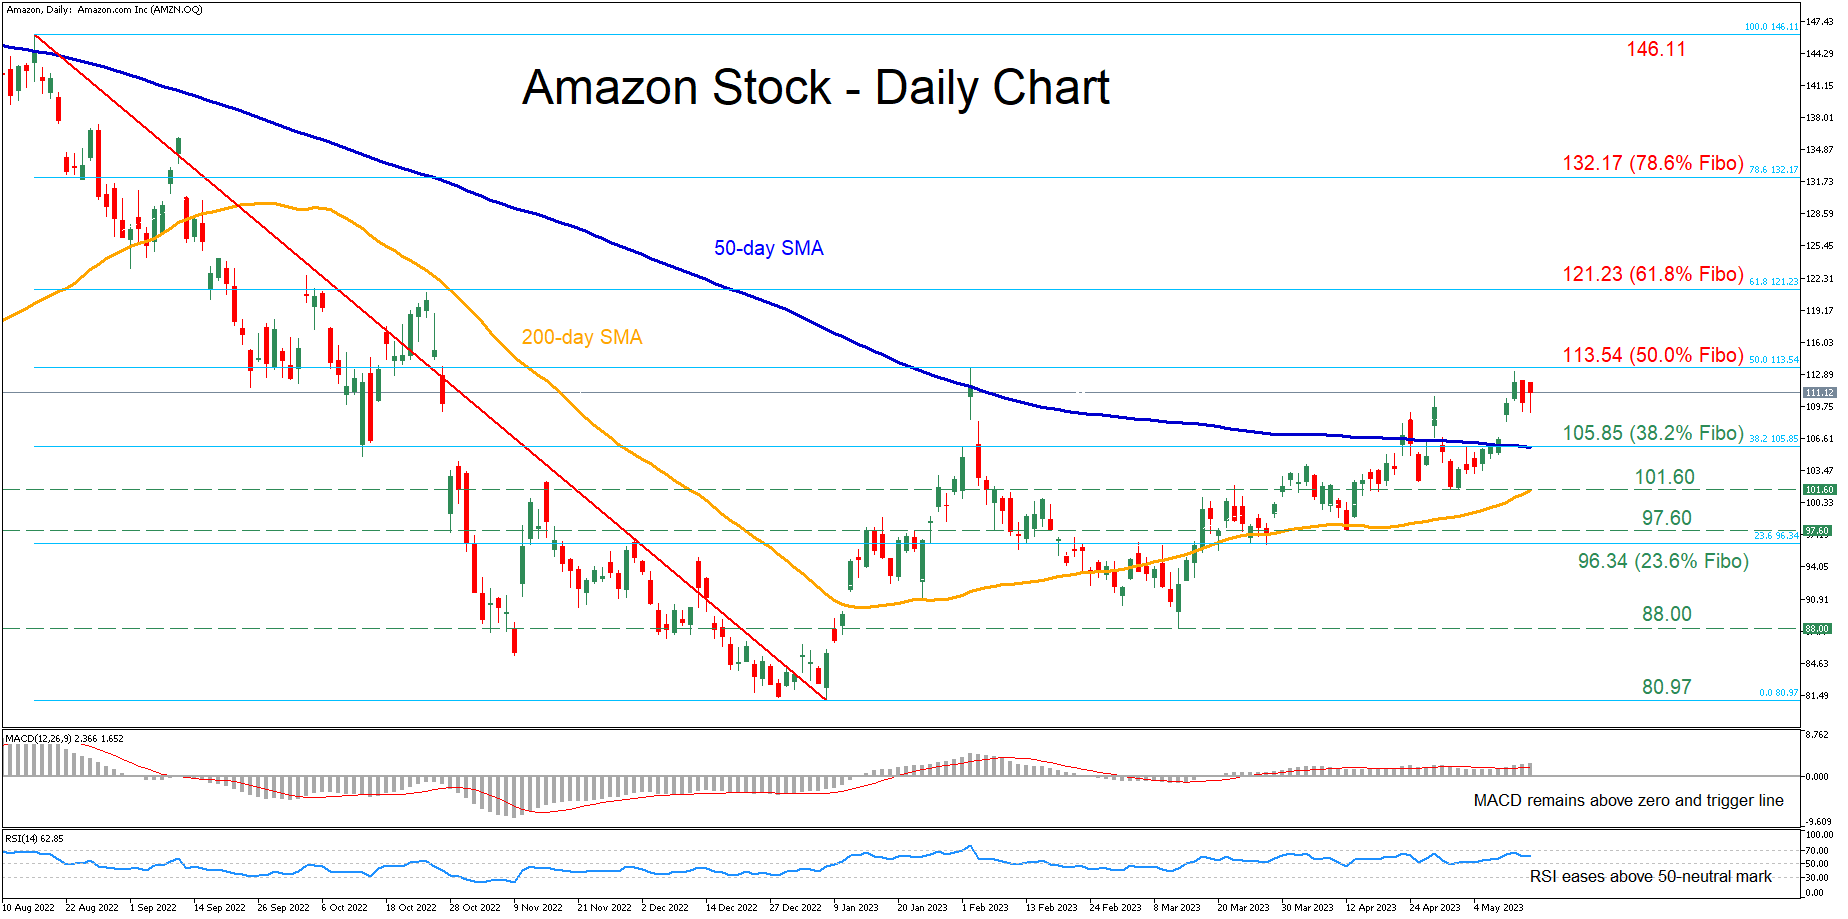
Amazon’s stock has been in a steady uptrend after encountering strong support at the 88.00 region in mid-March. In addition, the price jumped above both its 50- and 200-day simple moving averages (SMAs), with the latest rebound faltering just shy of the 2023 high of 113.54. Despite the recent weakness, the short-term oscillators remain tilted to the bullish side. Specifically, the MACD is strengthening above both zero and its red signal line, while the RSI is flatlining in the positive [..]

post-image

Technical Analysis – US 100 cash index close to a higher high, but bearish pressure increasing

Posted on May 16, 2023 at 7:16 am GMT

The US 100 index continues to edge higher reaching new highs. Since the October 13, 2022 low of 10,431, the index has been on an upwards path recording a series of higher highs and higher lows. The latest upleg since the March 13, 2023 low has been on the aggressive side with the bears desperate for a pullback. With the Average Directional Movement Index (ADX) stuck well below its 25-threshold, the onus falls on the stochastic oscillator to signal the next move. [..]

Technical Analysis – EURJPY is capped by 20-day SMA before bullish move can be continued

Posted on May 16, 2023 at 6:32 am GMT

EURJPY is capped by the 20-day simple moving average (SMA) around 148.20 after the rebound off the 146.35 support level. The short-term bias looks negative as the MACD keeps losing ground below its red signal line, while the RSI seems to be making its way down near its 50-neutral mark. The 20-day SMA currently at 148.20 could be a trigger point for steeper bullish action if the pair manages to break the line. Higher resistance could run towards the 15-year [..]

post-image

Technical Analysis – USDJPY climbs above key barrier of 135.40

Posted on May 15, 2023 at 12:35 pm GMT

USDJPY surged and broke above the key resistance barrier of 135.40 on Friday, after rebounding on Thursday from slightly below the uptrend line drawn from the low of March 24. Combined with the fact that the pair is also trading above all three of the plotted exponential moving averages (EMAs), this keeps the short-term picture positive. The bullish outlook is also confirmed by the short-term oscillators, both of which are detecting upside momentum. The RSI is lying near its 70 line and [..]

post-image

Technical Analysis – GER40 cash index is ready for another move

Posted on May 15, 2023 at 12:20 pm GMT

The GER40 cash index is a tad below the August 13, 2021 high of 16,030, and is flirting with the highest print since January 2022. It has recorded an impressive 35% rally since the October 3, 2022 low, but it now appears to be somewhat toppy. While the Average Directional Movement Index (ADX) is hovering below its 25-threshold and signaling a trendless market, the stochastic oscillator is ready to give a strong signal. It is currently battling with its moving [..]

Risk Warning: Your capital is at risk. Leveraged products may not be suitable for everyone. Please consider our Risk Disclosure.