XM does not provide services to residents of the United States of America.

Technical Analysis

post-image

Technical Analysis – EURUSD shows signs of bottoming out

Posted on June 8, 2023 at 2:05 pm GMT

EURUSD strengthened its positive momentum on Thursday, rising as high as 1.0758 despite disappointing GDP data out of the eurozone. The market structure has improved in the four-hour chart, with the pair marking a higher high at 1.0778 and a higher low at 1.0666, flagging a potential bullish trend reversal. A sustainable recovery above June’s high of 1.0778, where the long-term resistance line from May 2021 is placed, could further boost optimism for a bullish trend reversal, likely bringing the 200-period exponential [..]

post-image

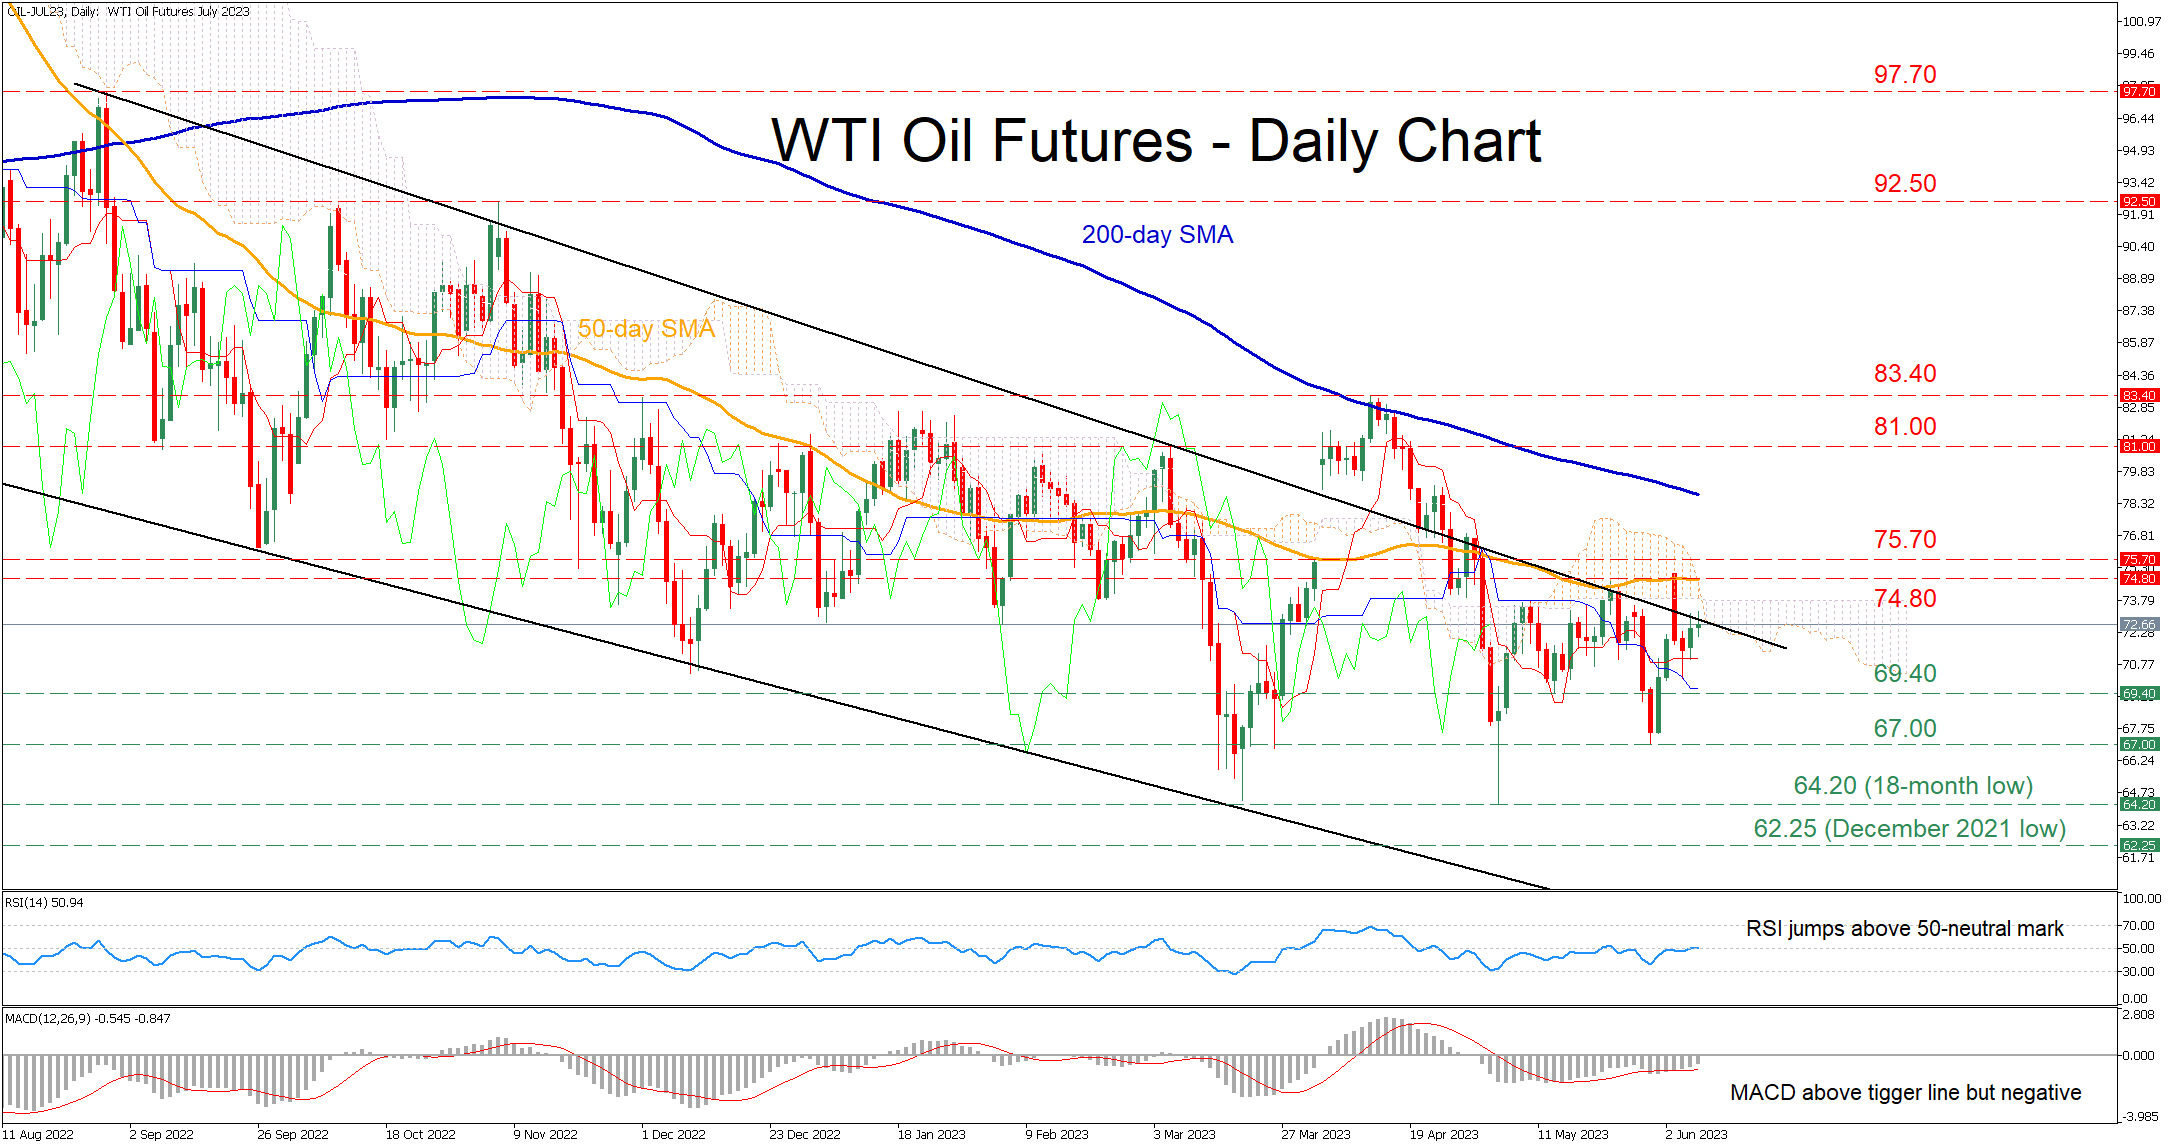
Technical Analysis – WTI futures retest restrictive trendline

Posted on June 8, 2023 at 1:40 pm GMT

WTI oil futures (July delivery) have been moving without a clear direction in the last month. Even though the commodity managed to spike above the upper end of its downward sloping channel after OPEC’s decision to cut output, the price quickly retraced lower and re-entered its long-term bearish pattern. The momentum indicators are reflecting a cautiously positive tone. Specifically, the RSI jumped above its 50-neutral mark, while the MACD is strengthening above its red signal line but remains in the negative zone. Should the [..]

post-image

Technical Analysis – ETHUSD remains directionless around 50-day SMA

Posted on June 8, 2023 at 11:18 am GMT

ETHUSD (Ethereum) has been trading sideways in the past two months, hovering around its 50-day simple moving average (SMA). Moreover, the digital coin has been forming a symmetrical triangle pattern, indicating that a breakout could occur soon. The momentum indicators currently suggest that near-term risks are tilted to the downside. Specifically, the stochastic oscillator is descending after posting a bearish cross, while the RSI dipped below its 50-neutral mark. Should sellers try to push the price lower, the recent support of [..]

post-image

Technical Analysis – GBPAUD bears want more but decisive support levels stand in their way

Posted on June 8, 2023 at 9:43 am GMT

GBPAUD is trading a tad below the busy 1.8701-1.8724 area, a sizeable correction following the April 28, 2023 high of 1.9034. This was the highest print for almost 15 months, with the pair also recording an impressive 18% increase since the September 26, 2022 low of 1.5937. The bears have a long way to go before declaring a short victory especially as the September 26, 2022 upward trendline awaits them a tad below the current levels. The overall technical picture [..]

Technical Analysis – EURGBP near floor level; 2023 downtrend intact

Posted on June 8, 2023 at 8:03 am GMT

EURGBP posted limited gains following the pivot from a six-month low of 0.8566 as the 0.8615 territory proved a tough obstacle this week. Previously, the pair stopped near the lower boundary of the channel containing the price action since the beginning of the year, hinting at a possible bullish reversal. The momentum indicators are higher than their recent lows, sustaining some hopes for a short-term recovery. However, the negative slope of the SMAs and the “death cross” between the 50- and 200-day SMAs suggest the 2023 [..]

post-image

Technical Analysis – US 30 cash index at inflection point

Posted on June 8, 2023 at 7:27 am GMT

The US 30 cash index is hovering around 33,518 and conforming to the recent series of lower highs. On the downside, the October 13, 2023 upward sloping trendline appears to be acting as a strong support. The US 30 index has essentially entered a range-trading phase as market participants are trying to figure out their next move, especially as other US stock indices rally aggressively. With the Average Directional Movement Index (ADX) confirming this trendless market and the RSI trading almost at [..]

Technical Analysis – AUDUSD rebounds strongly but 200-day caps upside

Posted on June 8, 2023 at 7:09 am GMT

AUDUSD had been trending lower after peaking at the upper end of its rectangle pattern in early May. Although the pair managed to recover firmly from its 2023 low of 0.6457 on the back of an unexpected 25 basis points hike by the RBA, its advance got rejected by the 200-day simple moving average (SMA). The momentum indicators are reflecting a cautiously positive tone. The RSI has flatlined above its 50-neutral mark, while the MACD is strengthening above its red signal line but remains [..]

post-image

Technical Analysis – Micron’s upward breakout in danger

Posted on June 7, 2023 at 2:14 pm GMT

Micron is hovering around the 67.41 level as the bears are trying to limit their losses from the May 24 upward breakout. This is the first serious upward breakout from the rectangle that has been dictating price action since June 2022. However, the upleg halted at the 50% Fibonacci retracement of the January 5, 2022 – September 23, 2022 downtrend at 73.31, prompting the current correction. Bears would love for the correction to continue but the momentum indicators are mixed in this [..]

post-image

Technical Analysis – EURCAD heads towards its winter lows

Posted on June 7, 2023 at 10:12 am GMT

EURCAD is marking its sixth week of losses, falling by more than 4.0% since creating a bearish double top structure around a two-year high of 1.5111. The pair is currently eyeing the key base of 1.4257, where the price pivoted higher in January and February. The 38.2% Fibonacci retracement of the previous upleg is also making this area important to watch ahead of the BoC rate decision due today at 14:00 GMT. It’s worthy to note that the 200-day simple [..]

post-image

Technical Analysis – Silver back inside its early 2023 rectangle

Posted on June 7, 2023 at 9:44 am GMT

Silver is edging lower today as market participants weigh their options after the sizeable correction. The recent double top pattern achieved its theoretical target of 22.90 and thus does not appear to exert bearish pressure anymore. Silver has actually returned inside its December 2022-February 2023 rectangle, hence pointing to a range-trading phase. The bears are keen on another sell-off, but the momentum indicators are sending a very mixed signal at this stage. The Average Directional Movement Index (ADX) is slightly [..]

Risk Warning: Your capital is at risk. Leveraged products may not be suitable for everyone. Please consider our Risk Disclosure.