XM does not provide services to residents of the United States of America.

Technical Analysis

Technical Analysis – GBPJPY flatlines near 7½-year peak

Posted on June 30, 2023 at 8:12 am GMT

GBPJPY has been stuck in a prolonged uptrend since the beginning of the year, generating a structure of consecutive multi-year highs. In the near-term, the price seems to be consolidating near the 7½-year high of 183.74, appearing to be unable to extend its rally. The momentum indicators currently suggest that bullish forces are waning. Specifically, the MACD dropped below its red trigger line but remains positive, while the stochastic oscillator is descending after exiting its oversold zone. Should buying pressures fade [..]

post-image

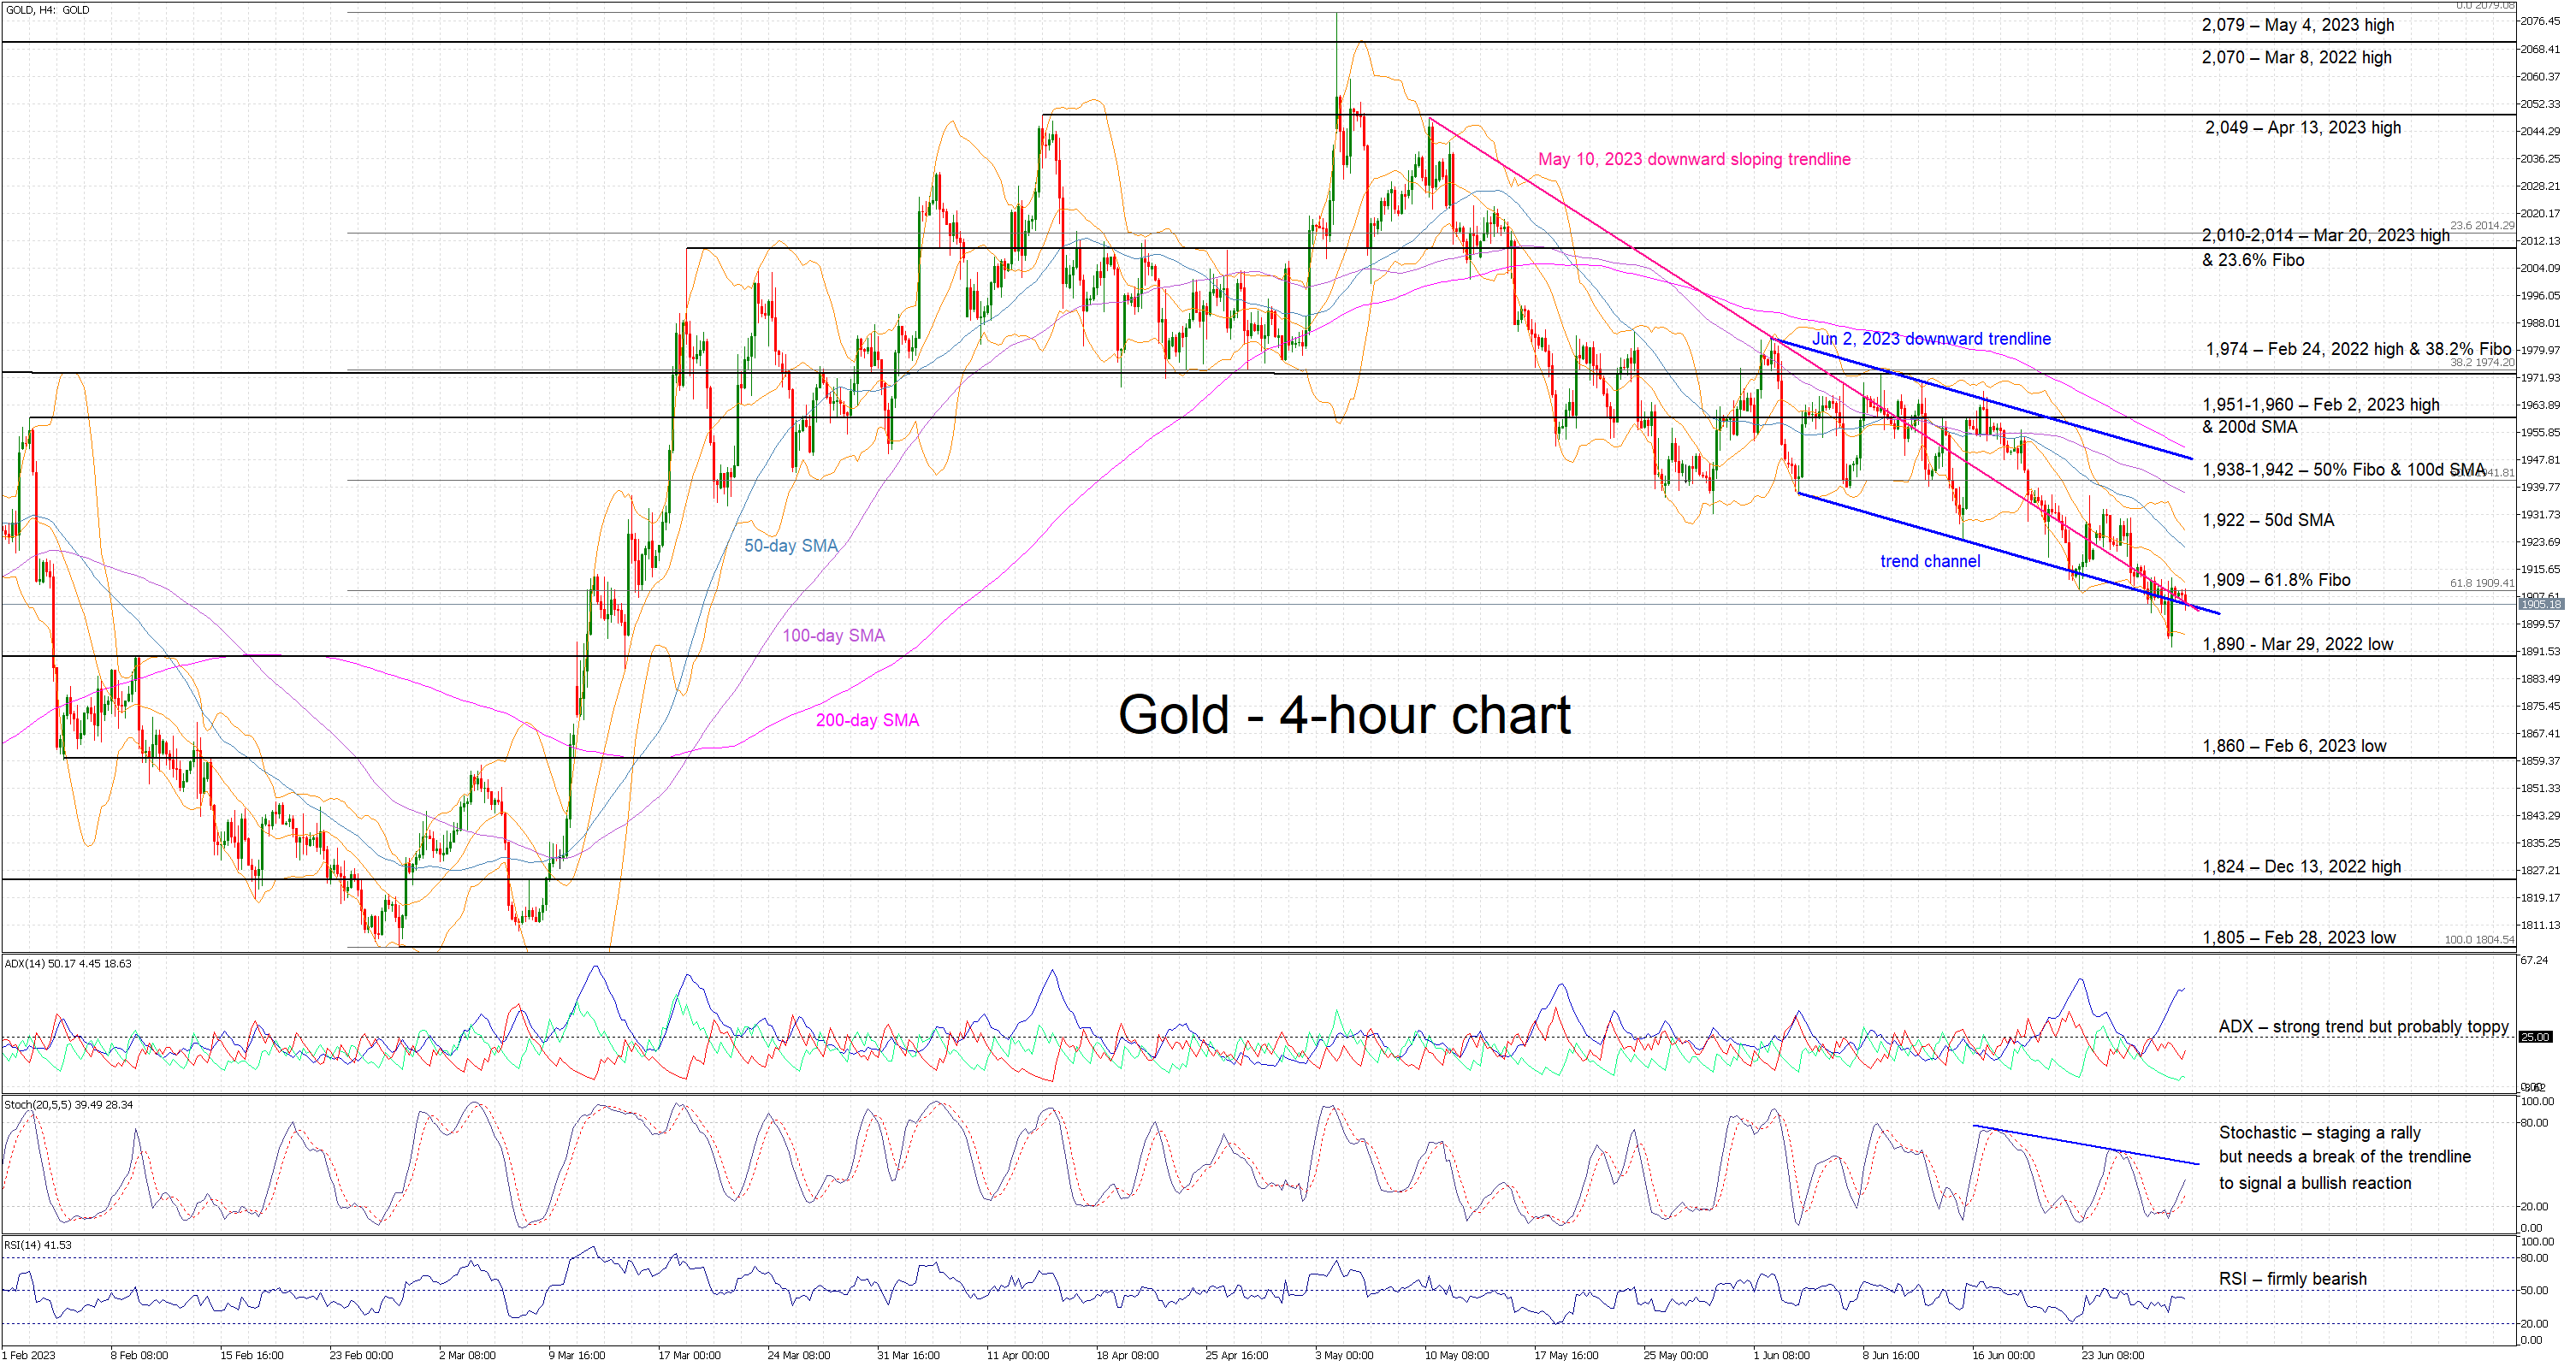
Technical Analysis – Gold at a crossroads

Posted on June 30, 2023 at 7:57 am GMT

Gold is gliding lower today, trading close to its lowest level since March 2023 and carrying on the bearish trend that kicked off on June 2, 2023. It is currently battling with the lower boundary of the recent trend channel and the May 10, 2023 downward sloping trendline. Gold had a quick look at the sub-1,900 area yesterday but quickly bounced higher, revealing pockets of resistance in this area. The momentum indicators are somewhat split at this stage. The RSI remains [..]

Technical Analysis – Has USDCAD started a new bullish cycle?

Posted on June 30, 2023 at 7:49 am GMT

USDCAD rose quickly above the tight bearish channel, but soon stopped around February’s lows and near its 20-day SMA on Thursday. The pair is set to close the month down by 2.3%, marking its worst monthly performance since 2021. That said, the recent bullish channel breakout continues to look promising as both the RSI and MACD are showing a convincing improvement, indicating an encouraging start to July. If the 20-day SMA at 1.3270 gives way, the price may advance straight to [..]

post-image

Technical Analysis – EURAUD sell-off hopes might be premature

Posted on June 29, 2023 at 2:54 pm GMT

EURAUD is edging lower today, bouncing off both the February 15, 2023 upward sloping trendline and the 1.6583 level. This is actually the first red candle after nine consecutive green days, as the bears are desperately looking to recover some of their recent losses and hoping to reestablish the pattern of lower highs and lower lows. Today’s price action, though, appears to counter the message coming from the momentum indicators. The Average Directional Movement Index (ADX) is pointing to the strongest [..]

post-image

Technical Analysis – JP225 cash index recent correction might have legs

Posted on June 29, 2023 at 1:25 pm GMT

The JP225 cash index is trading lower today as the bulls are trying to overcome the first decent correction since the current uptrend started on March 15, 2023, and are mentally preparing for another all-time high. However, the overall upward movement remains overstretched and hence corrections might take place more often and be more forceful than the bulls would prefer. The momentum indicators are probably supporting the increasing bearish pressure. The Average Directional Movement Index (ADX) is still moving lower, signaling that the [..]

post-image

Technical Analysis – US 30 cash index range-trading continues

Posted on June 29, 2023 at 7:43 am GMT

The US 30 cash index bounced off its 50-day simple moving average (SMA) and it is now hovering around the 33,754 area. The bulls have managed to record a series of higher lows and they are apparently looking ahead to the recent 34,577 high in their attempt to establish a more sustained bullish trend. However, they firstly have to overcome the current market lull that is clearly depicted in the relative tightening of the Bollinger bands. Similarly, the momentum indicators appear to have [..]

Technical Analysis – WTI futures remain flat within bearish channel

Posted on June 29, 2023 at 7:43 am GMT

WTI oil futures (August delivery) have been moving within their downward sloping channel for the last 10 months, creating a structure of lower highs. In the near term, the price has been directionless, slightly below the 70.00 region following a moderate pullback from the 50-day simple moving average (SMA). The momentum indicators currently suggest that bearish forces are holding the upper hand. Specifically, the RSI has flatlined below its 50-neutral mark, while the MACD is softening below both zero and its [..]

Technical Analysis – AUDUSD erases June’s upleg; bias bearish

Posted on June 29, 2023 at 7:25 am GMT

AUDUSD sank to a three-week low of 0.6596 on Wednesday as the bulls could not find enough buyers to jump above the 200-day simple moving average (SMA) at 0.6690. The pair is marking its second negative week, having trimmed more than half of June’s bull run to 0.6898. Downside pressures could persist in the coming sessions as the technical indicators continue to slope southwards. The falling RSI has yet to reach its 30 oversold level, while the MACD remains negatively charged [..]

post-image

Technical Analysis – Exxon Mobil stock stuck in tight range

Posted on June 28, 2023 at 2:59 pm GMT

Exxon Mobil is trading sideways today, breaking the latest run of consecutive green candles. The stock remains stuck in a tight range as market participants appear to be evaluating their strategy amid a sizeable correction following the recent all-time high of 119.78. The momentum indicators are confirming this muted price action. The Average Directional Movement index (ADX) is hovering in its range-trading territory, and the RSI remains just a tad above its 50-midpoint with a tendency for lower prints. The [..]

post-image

Technical Analysis – BTCUSD tests symmetrical triangle as advance falters

Posted on June 28, 2023 at 1:05 pm GMT

BTCUSD has posted significant gains in the past two weeks, breaking above the downwards sloping trendline that connected its lower highs since April 14 and posting a fresh 2023 peak of 31,416. However, the digital coin experienced a pullback, with the price currently challenging the base of the symmetrical triangle. The momentum indicators currently suggest that downside risks are intensifying. Specifically, the stochastic oscillator is descending after posting a bearish cross, while the RSI has crossed below its 50-neutral mark. Should [..]

Risk Warning: Your capital is at risk. Leveraged products may not be suitable for everyone. Please consider our Risk Disclosure.