XM does not provide services to residents of the United States of America.

Technical Analysis

post-image

Technical Analysis – US 500 cash index rally continues; a correction is long overdue

Posted on July 18, 2023 at 6:50 am GMT

The US 500 cash index continues its advance, and it is currently trading at the highest level since April 6, 2022. The move since the March 13, 2023 low has been exponential with the lack of significant corrections being very visible at this stage. The index is currently hovering below the busy 4,533-4,550 area, as the bulls appear keen to record another 2023 high. In the meantime, while the momentum indicators are clearly on the bulls’ camp, there are some [..]

Weekly Technical Analysis – USDJPY, GBPUSD, Gold

Posted on July 17, 2023 at 1:16 pm GMT

Following a disastrous week for the US dollar, investors will be eagerly waiting for retail sales data to provide a helping hand to the currency on Tuesday. Gold will be closely watched for the same reason as a weakening dollar has been great for the precious metal lately. Meanwhile in the UK, CPI inflation figures could next challenge the rocket rally in the pound on Wednesday. US retail sales –> USD/JPY Retail sales data will be the next highlight in on [..]

post-image

Technical Analysis – EURCHF breaks rectangle but will the move last?

Posted on July 17, 2023 at 12:10 pm GMT

EURCHF is edging lower today, experiencing the second bearish breakout of the rectangle that has been defining the price action since October 13, 2022. It is currently trading slightly above the July 13, 2023 low of 0.9607, its lowest print since September 30, 2022, and battling with the 0.9650-0.9665 range that eluded the bears during the May 30 drop. In the meantime, the Average Directional Movement Index (ADX) jumped above its 25-threshold, confirming the presence of a bearish trend in the market. [..]

post-image

Technical Analysis – EURUSD plays defense near overbought conditions

Posted on July 17, 2023 at 8:00 am GMT

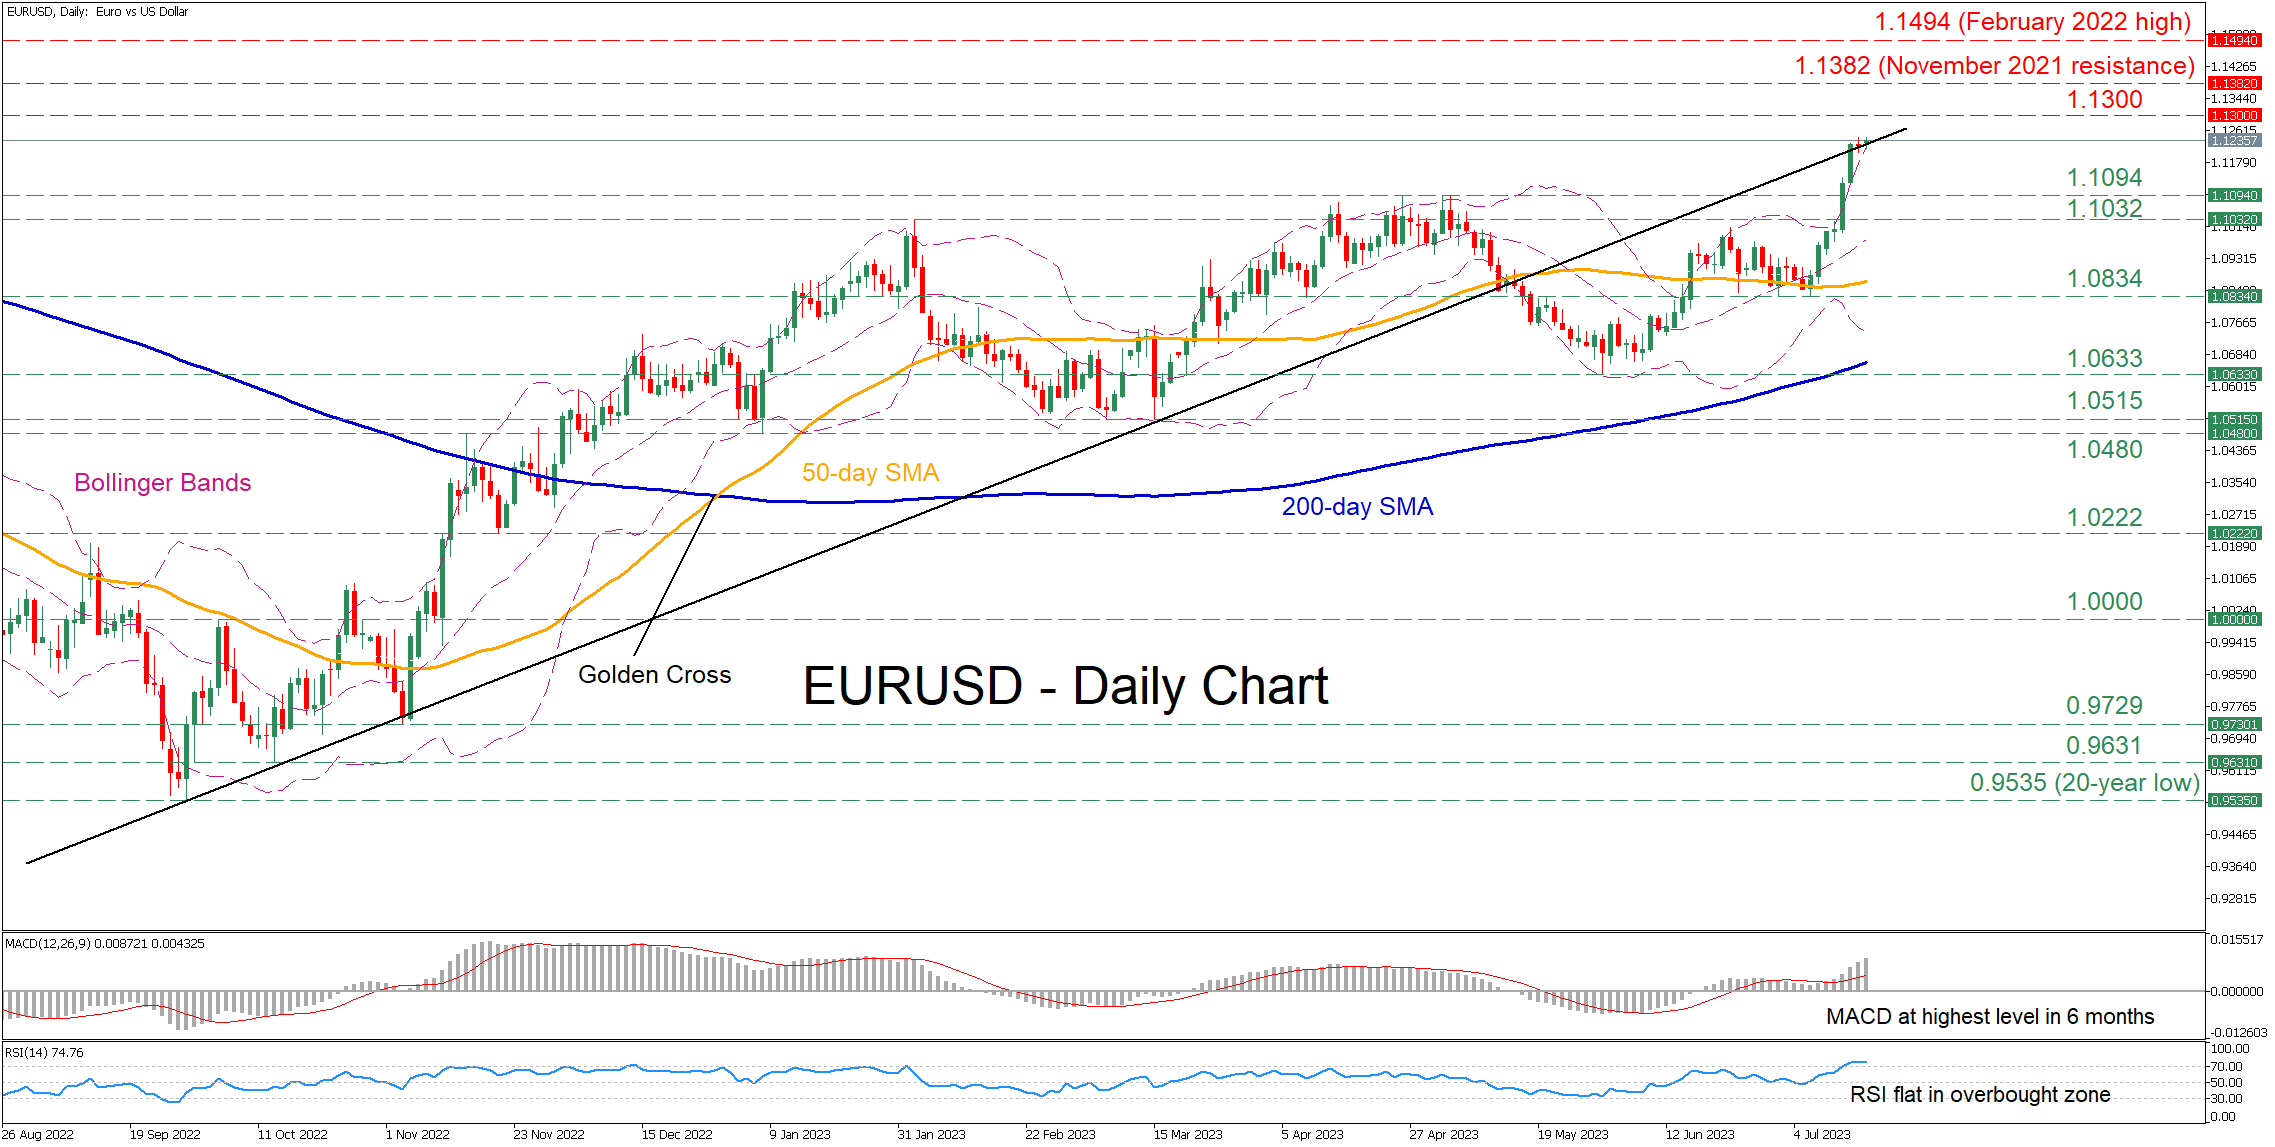
EURUSD has experienced significant gains in the past 10 days, smashing its recent resistance levels and posting a fresh 17-month peak last Friday. However, it seems that the bulls cannot extend the recent rally as the pair has approached overbought conditions. The momentum indicators currently suggest that the recent rally could be overstretched. Specifically, the MACD is not only above both zero and its red signal line but also at its highest levels since January 2023, while the RSI is directionless within [..]

post-image

Technical Analysis – Bank of America stock edges higher but bears are still in control

Posted on July 14, 2023 at 10:03 am GMT

Bank of America (BofA) stock recorded a green candle at yesterday’s session as a very important earnings period gets underway. It has been a tough period for the bulls as the stock remains significantly below the pre-March 2023 highs. However, it is trying to stay above the February 10, 2022 downward sloping trendline and to register a series of higher highs and lower highs. This could help the stock to finally stage a move towards the 31.30 area. In the [..]

Technical Analysis – USDCHF freefall hits channel’s bottom line

Posted on July 14, 2023 at 8:09 am GMT

USDCHF sank to its lowest level since January 2015 when the Swiss National Bank shocked markets by scrapping its three-year-old cap on the Swiss franc. The pair is currently consolidating its 4.0% weekly freefall near the lower boundary of the broad bearish channel slightly below 0.8600. This is where the price drifted higher in January 2015. Therefore, with the RSI and the Stochastics having dived significantly within the oversold zone, an upside reversal could be possible in the coming sessions. [..]

post-image

Technical Analysis – GBPJPY correction is underway but will it last?

Posted on July 14, 2023 at 6:49 am GMT

GBPJPY is trading sideways today as the first correction since the March 2023 lows is underway. The current drop has halted at the important March 23, 2023 upward sloping trendline with the pair now hovering a tad below the April 9, 2001 high of 181.42. The overall technical picture is more mixed at this juncture as most indicators seem to have reset after significant advances. The Average Directional Movement Index (ADX) is moving sideways, following an aggressive drop from its recent [..]

post-image

Technical Analysis – US 30 cash index close to a new 2023 high but picture less than rosy

Posted on July 13, 2023 at 1:38 pm GMT

The US 30 cash index is edging higher again today, but a triple-top pattern appears to be forming. This type of structure is not uncommon in this market, but it clearly casts a shadow on the current rally. A potential break of the 33,605 neckline would brand this structure as valid with its 32,700 target becoming active. The negative news for the bulls appears to continue as the momentum indicators are not fully endorsing the current upleg. More specifically, the RSI is [..]

Technical Analysis – EURUSD extends bullish race; resistance nearby

Posted on July 13, 2023 at 7:45 am GMT

EURUSD skyrocketed to sixteen-month highs in the wake of the US CPI data on Wednesday, experiencing one of its best daily performances this year. The pair inched up to a new high of 1.1173 early on Thursday, raising speculation that the bullish wave might have more room for improvement. That said, some caution might be necessary as the price is trading around the tentative resistance line from February at 1.1145 and slightly below the 1.1185-1.1220 constraining zone, which had been limiting both upside and [..]

Technical Analysis – AUDUSD breaks rectangle; fifth time lucky for the bulls?

Posted on July 13, 2023 at 6:59 am GMT

AUDUSD bulls are staging their fifth breakout, hoping to be more successful this time around and to finally break the rectangle that has been dominating the price action since February 24, 2023. The overall technical picture is positive for the bulls. The RSI has jumped above its 50-midpoint, and it is now trying to make a higher high. More importantly, the stochastic oscillator has broken above its moving average and it is now moving higher in a vertical fashion. If [..]

Risk Warning: Your capital is at risk. Leveraged products may not be suitable for everyone. Please consider our Risk Disclosure.