XM does not provide services to residents of the United States of America.

Technical Analysis

post-image

Technical Analysis – US 100 index makes new higher highs

Posted on July 19, 2023 at 11:18 am GMT

The US 100 stock index (cash) revived its 2023 bullish outlook after a constructive week, marking a new higher high at 15,986 on Tuesday. The uptrend shows no signs of abating despite warnings of an overbought market from the RSI and the Stochastic oscillator. The upward-sloping moving averages (SMAs) are endorsing the positive trajectory in the market as the price is aiming for the 16,000 psychological number. Yet, some caution might develop in the coming sessions as the index is facing limitations [..]

post-image

Technical Analysis – Netflix stock aims to fill gap after Q2 earnings call

Posted on July 19, 2023 at 11:03 am GMT

Netflix’s stock has been staging a massive recovery after posting a five-year low of 161.40 in May 2022. Moreover, the price jumped to a fresh 1½-year high of 477.65 in the latest daily session just one day ahead of its Q2 earnings announcement, attempting to fill the January 2022 gap. The short-term oscillators are clearly tilting to the bullish side. Specifically, the RSI has crossed above its 70-overbought mark, while the MACD jumped above its red trigger line for the [..]

post-image

Technical Analysis – Gold consolidates after posting fresh 2-month peak

Posted on July 19, 2023 at 8:17 am GMT

Gold has been in an uptrend since late June when the price found its feet slightly below the 1,900 psychological mark. Even though bullion recently stormed to a fresh two-month high of 1,984, it has been trading sideways for the last few four-hour sessions, appearing unable to extend its rally. The momentum indicators are endorsing a bullish near-term bias. Specifically, the RSI is holding above its 70-overbought zone, while the MACD is strengthening above both zero and its red signal [..]

Technical Analysis – EURGBP powers higher after UK CPI miss

Posted on July 19, 2023 at 8:06 am GMT

EURGBP experienced a sharp increase from softer-than-expected UK CPI inflation numbers, with the price rising as high as 0.8673 – the fastest daily increase since March 21. Today’s quick pick up sent the RSI back above its 50 neutral mark and the MACD further above its red signal line and closer to zero. Still, a bullish bias cannot be guaranteed as the stochastic oscillator is already comfortably above its 80 overbought level. Moreover, the price is trading around the the [..]

Technical Analysis – USDJPY resumes advance; prepares to test a key resistance area

Posted on July 19, 2023 at 7:06 am GMT

USDJPY is trading higher again today following a significant correction that muted the growing intervention talk. The pair is preparing to enter a very busy area as the bulls are trying to regain market control and take advantage of the continued simple moving averages (SMAs) convergence for their own benefit. The momentum indicators appear to be mostly on the bulls’ side at this stage. The Average Directional Movement Index (ADX) is edging lower today, confirming a much weakened bearish trend [..]

post-image

Technical Analysis – AUDUSD consolidates after validating double-top pattern

Posted on July 18, 2023 at 2:26 pm GMT

AUDUSD had been re-gaining ground in the four-hour chart after its recent decline ceased at 0.6594. However, this recent rebound got rejected near the June high of 0.6898, with the price forming a double-top pattern before retracing lower. This latest pullback is also confirmed by the momentum indicators. Specifically, the stochastics are descending after posting a bearish cross and the MACD is retreating further towards zero, while remaining well below its red trigger line. Should the recent pullback extend, the price [..]

post-image

Technical Analysis – Tesla posts fresh 9-month high ahead of Q2 earnings

Posted on July 18, 2023 at 1:05 pm GMT

Tesla’s stock has been in a sustained uptrend since late April when it found its feet at the 152.00 support zone. Moreover, in the latest daily session, the price jumped to 291.60, its highest level since September 2022 just two trading sessions ahead of the firm’s Q2 earnings report. Despite this strong rally, the momentum indicators are currently reflecting a divergence. The MACD remains positive but below its red signal line, while the RSI has entered the 70-overbought territory. Should [..]

post-image

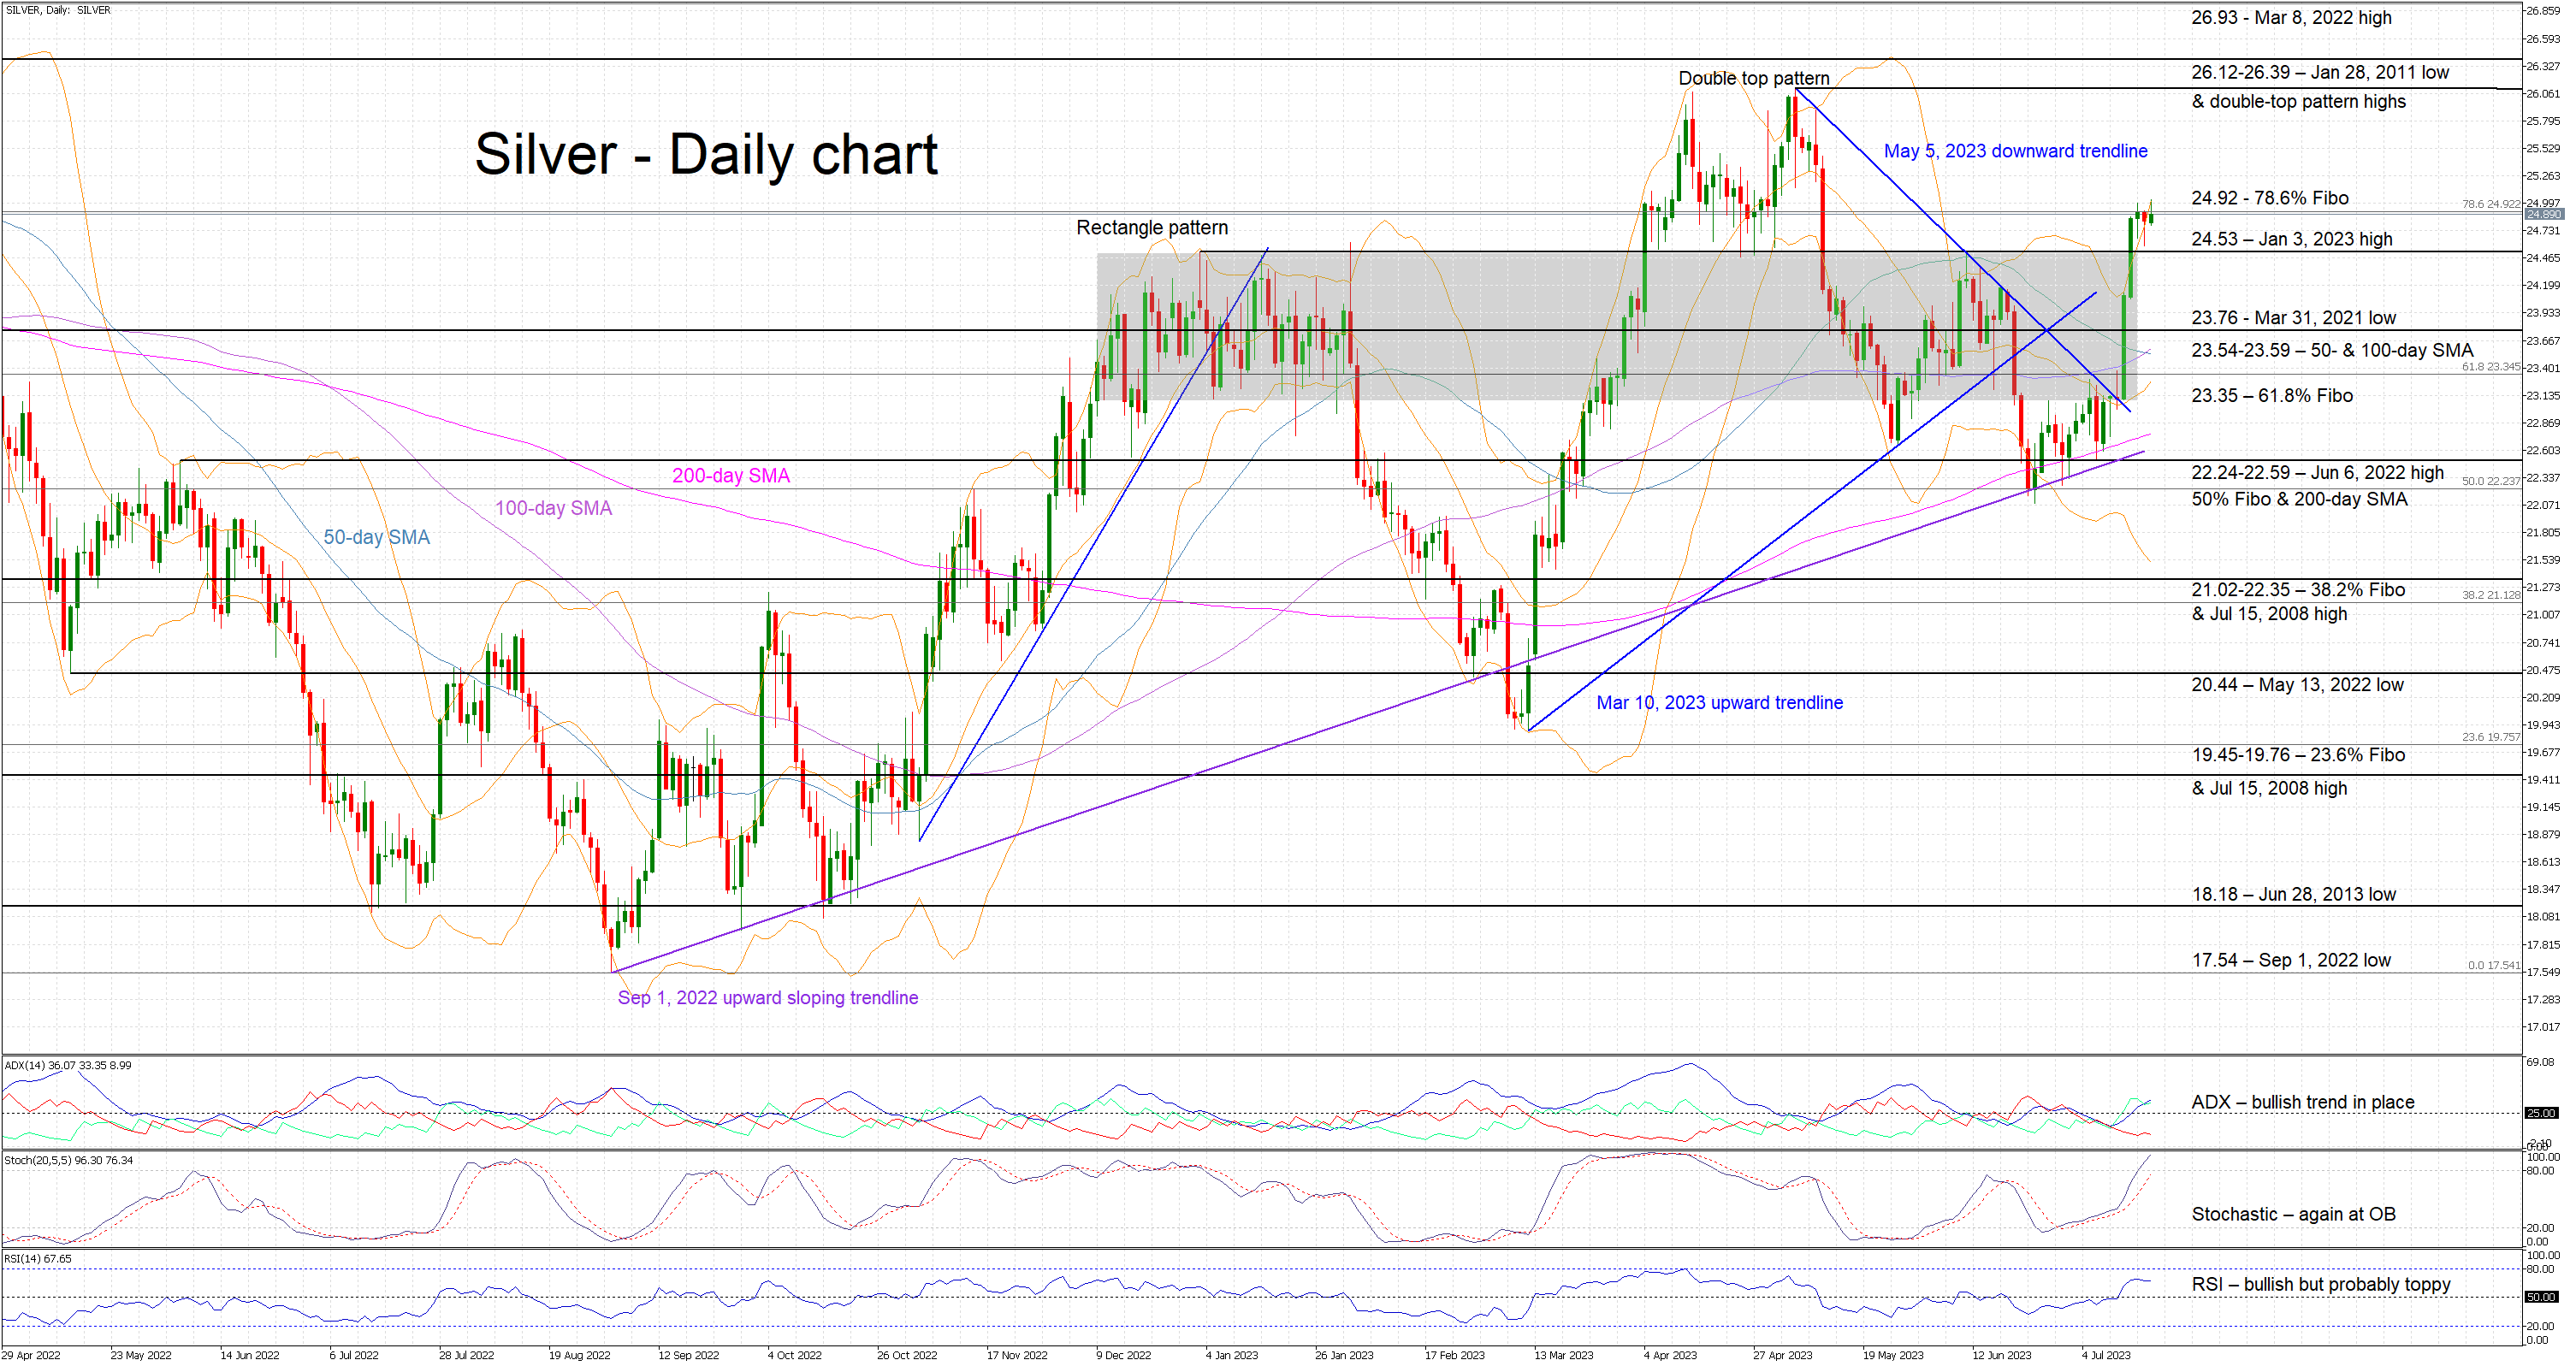
Technical Analysis – Silver stabilizes above recent rectangle

Posted on July 18, 2023 at 10:53 am GMT

Silver is edging higher today but continues to hover around the 24.92 level. The bulls have staged another breakout of the December 2022-February 2023 rectangle, breaking the recent series of lower lows and lower highs, but the 7.5% jump in just two days does not appear to have a follow-through. The momentum indicators are mostly on the bulls’ side at this juncture. The Average Directional Movement Index (ADX) is finally above its 25-threshold and hence pointing to a strong bullish trend in [..]

Technical Analysis – EURJPY’s recovery attempt stalls; signals mixed

Posted on July 18, 2023 at 8:08 am GMT

EURJPY opened the week with a doji candlestick slightly lower than the 20-day SMA at 156.30, following its rebound from the March support trendline. The trendline bounce indicates the positive trend will persist, yet Monday’s doji candlestick may bring doubt. In momentum indicators, the RSI is maintaining a negative trajectory despite climbing back above its 50 neutral mark. The MACD is within the positive zone and comfortably below its red signal line, while the stochastic oscillator is nearing its 80 [..]

Technical Analysis – GBPUSD pulls back from 15-month peak; bullish structure holds

Posted on July 18, 2023 at 8:08 am GMT

GBPUSD has been in a prolonged uptrend since October 2022 supported by its long-term ascending trendline. Last Friday, the pair stormed to a fresh 15-month high of 1.3141 before paring some gains, but it is still too early to call this a downside correction. However, the momentum indicators are holding well within their overbought territories, hinting that the recent pullback could extend. Specifically, the stochastic oscillator is negatively charged within its 80-overbought territory, while the RSI remains directionless in overbought conditions. If [..]

Risk Warning: Your capital is at risk. Leveraged products may not be suitable for everyone. Please consider our Risk Disclosure.