XM does not provide services to residents of the United States of America.

Technical Analysis

post-image

Technical Analysis – Nvidia set to erase pullback, new record high in sight?

Posted on August 16, 2023 at 10:22 am GMT

Nvidia’s stock has experienced an exponential surge since the beginning of the year, gaining around 250% before experiencing a minor pullback. Despite falling below its 50-day simple moving average (SMA) for the first time in eight months, the stock price rebounded strongly and appears to be on track to revisit its recent all-time high. The momentum indicators are endorsing this latest jump. Specifically, the stochastic oscillator is ascending steeply after posting a bullish cross in the oversold zone, while the RSI [..]

post-image

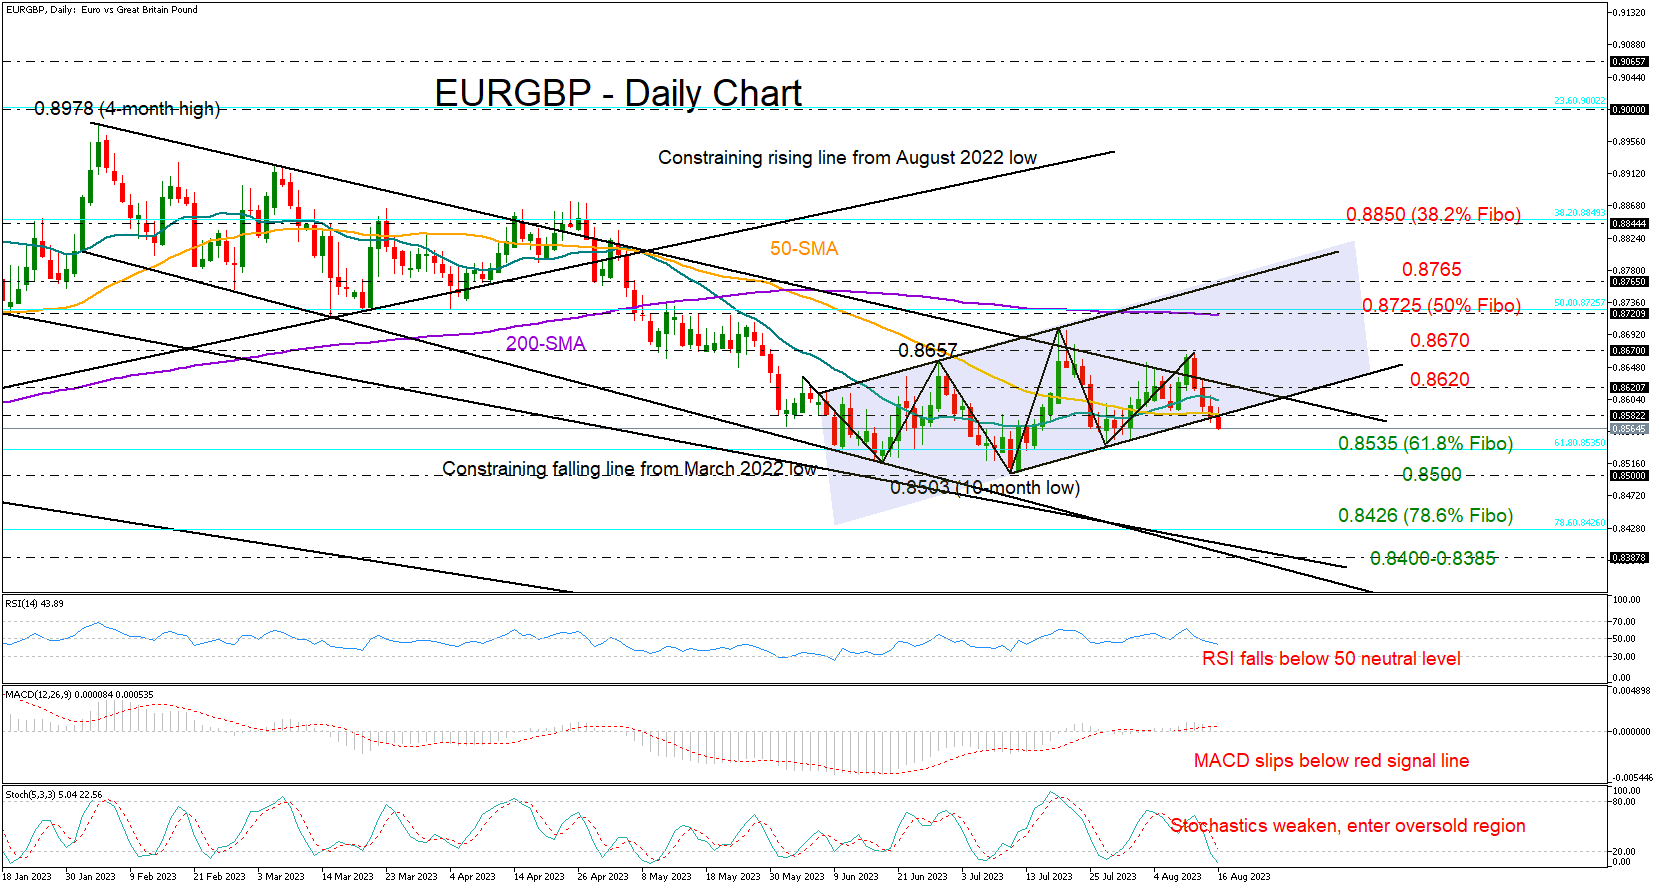
Technical Analysis – EURGBP reconsiders its bullish mission

Posted on August 16, 2023 at 9:17 am GMT

EURGBP could not find enough buyers to print a new higher high above July’s peak of 0.8700 last week, pausing its latest upleg lower at 0.8668. Unfortunately, the bears are currently trying to push the price below the short-term bullish channel and the 50-day SMA, which previously prevented a drop below 0.8585. The downward trajectory in the momentum indicators is endorsing the negative momentum in the price, though only a decisive close below the previous low and the 61.8% Fibonacci retracement [..]

post-image

Technical Analysis – Gold below key resistance trendline

Posted on August 16, 2023 at 8:05 am GMT

Gold stayed buoyant above the 1,900 psychological mark despite experiencing a flash drop to a seven-week low of 1,896 on Tuesday. The precious metal is currently trying to regain some ground as the RSI and the Stochastic oscillators are deviating above their oversold levels. A major resistance area, however, is still overhead. The price could still get another rejection from the downward-sloping trendline at 1,907 and the 20-period simple moving average (SMA). Notably, the 61.8% Fibonacci retracement level of the March-May uptrend is marginally [..]

post-image

Technical Analysis – NZDUSD bulls react but probably still far from a reversal

Posted on August 16, 2023 at 7:44 am GMT

NZDUSD is finally edging higher today following four consecutive red candles and after registering a new 2023 low. It appears to be the bulls’ first serious attempt to put a stop to the bearish breakout from the rectangle that has been in place since February 2023. They could potentially threaten the aggressive July 14, 2023 downward sloping trendline that NZDUSD has actually been religiously respecting. The momentum indicators continue to reflect the recent downleg from the mid-July NZDUSD highs. However, [..]

post-image

Technical Analysis – USDJPY flat near intervention zone

Posted on August 16, 2023 at 7:22 am GMT

USDJPY has been storming higher in the short term, posting a fresh 9-month high of 145.85 on Tuesday before paring some gains. Undoubtedly, the pair has approached a critical technical region around where the first round of intervention by the Japanese authorities took place, thus traders should be cautious as the probability of an impending correction has increased. The momentum indicators currently suggest that bullish forces are intensifying. Specifically, the MACD is strengthening above zero and its red signal line but has not yet [..]

post-image

Technical Analysis – EURJPY hits fresh 15-year high as yen gets smoked

Posted on August 15, 2023 at 9:26 am GMT

EURJPY has been grinding higher, hitting its best levels in 15 years earlier today. The series of higher highs and higher lows remains in place, keeping the pair in a clear uptrend.  As a testament to how powerful the rally has been, the pair is trading near its upper Bollinger band and well above its longer-term moving averages (MAs). Similarly, momentum indicators such as the RSI and the MACD are flashing bullish signals, although neither is at extreme levels yet.  [..]

post-image

Technical Analysis – GBPUSD rally loses power, all eyes on 1.2610

Posted on August 15, 2023 at 7:07 am GMT

GBPUSD has been on the retreat for one month now, trading below a short-term downtrend line and its 50-day moving average (MA). But in the bigger picture, the pair is still in an uptrend that started back in September.  This misalignment puts extra emphasis on the 1.2610 region. If sellers pierce below this area, it would mark a lower low on the daily chart, sending a strong signal that the longer-term uptrend has started to break down.  Momentum oscillators like [..]

post-image

Technical Analysis – US 100 cash index bears appear to be thirsty still

Posted on August 14, 2023 at 11:50 am GMT

The US 100 index is edging higher but the bearish pressure following the July 19, 2023 peak of 15,931 remains potent. It looks like the bears are determined to register the first sizeable pullback since the March 2023 events, in a desperate attempt to recoup part of their significant recent losses.  Obviously, the momentum indicators have taken notice of this bearish reaction. The Average Directional Movement Index (ADX) has broken above its 25-threshold, thus signalling a muted bearish trend in the market, [..]

post-image

Technical Analysis – Gold on track to test ascending 200-day SMA

Posted on August 14, 2023 at 10:55 am GMT

Gold had been experiencing a pullback following its recent peak at 1,987, with the price slicing through both its 50-day simple moving average (SMA) and the Ichimoku cloud. What’s more interesting though is that the price is closing the gap with the upward sloping 200-day SMA, which is a crucial technical zone for bullion. The short-term oscillators are indicating that the recent decline is likely to accelerate. Specifically, the MACD is weakening further below zero and its red trigger line, while [..]

post-image

Technical Analysis – EURUSD rangebound but bears attack crucial trendline

Posted on August 14, 2023 at 7:51 am GMT

EURUSD has been trading sideways for the past two weeks after experiencing a downside correction from its 17-month high of 1.1275. However, the technical picture is slowly tilting towards the bearish side as the price has fallen beneath both the 50-day simple moving average (SMA) and the ascending trendline that connects its higher lows since September 2022. The momentum indicators currently suggest that bearish forces are intensifying. Specifically, the MACD is softening below both zero and its red signal line at [..]

Risk Warning: Your capital is at risk. Leveraged products may not be suitable for everyone. Please consider our Risk Disclosure.