XM does not provide services to residents of the United States of America.

Stock Market News

post-image

Technical Analysis – US dollar index lacks direction above 200-MA

Posted on April 10, 2020 at 11:52 am GMT

US dollar index’s latest dip appears to be pausing ahead of the 200-period simple moving average (SMA), reflecting an unclear direction after the push up from the 98.38 trough. The flat demeanour of the 200-period SMA and the conflicting signals between the 50- and 100-period SMAs further back the uncertain course. Moreover, the price actions’ frozen state is also mirrored within the directional momentum in the short-term oscillators. The MACD has slipped marginally below zero and its red trigger line. [..]

post-image

Technical Analysis – US 30 index claws its way higher as recovery persists

Posted on April 9, 2020 at 2:36 pm GMT

The US 30 index has recovered a good chunk of its losses in the past couple of weeks and is now posting higher highs and higher lows on the four-hour chart above a short-term uptrend line drawn from the March 23 bottom. The immediate-term outlook therefore seems to have turned positive, and for that to change, the bears would need to pierce below the 22,350 area and the uptrend line. Momentum oscillators endorse the improving picture, with the RSI looking [..]

post-image

Technical Analysis – US 500 stock index in neutral phase in near term; recoups some losses

Posted on April 6, 2020 at 12:33 pm GMT

The US 500 cash index has been developing within a narrow range over the last two weeks with upper boundary the 38.2% Fibonacci retracement level of the down leg from 3,396.64 to 2,173.95 at 2,646 and lower boundary the 2,440 support level. The momentum indicators are pointing to a neutral to positive bias in the short term, suggesting the possibility of an upside reversal. The RSI is just below 50 and the MACD oscillator is heading north above its trigger line, though with weak momentum. In the event [..]

post-image

Is this a light at the end of the stock tunnel or just a flashlight? – Special Report

Posted on April 3, 2020 at 1:36 pm GMT

Stock prices are making a V turn after experiencing the sharpest downfall since financial crisis and bargain hunters are looking for the right time to buy. Hopefully, there are reasons to believe that the positive trend could continue, though on the other hand it is too early to rule out a dead cat bounce, and it is even challenging to predict a full recovery after the virus drama ends. Hence, while it looks like a good opportunity to get exposure to the market, a portfolio overloaded [..]

post-image

Technical Analysis – US 500 index’s correction weakens under 100-SMA

Posted on March 30, 2020 at 12:00 pm GMT

US 500 index (Cash) seems to have lost steam in its pullback from the multi-year low of 2,183.95 dropping the price back to its mid-Bollinger band around the 100-period simple moving average (SMA) at 2,561. The stall in positive momentum is also reflected in the short-term oscillators. The MACD, in the positive region, has dropped below its red trigger line, while the RSI, declined to hover above its neutral mark. On top of this, the downward sloping 100- and 200-period [..]

post-image

Technical Analysis – US 500 Index attempts to correct from 39-month low

Posted on March 23, 2020 at 1:48 pm GMT

US 500 index (Cash) gapped today underneath the inside swing low of 2,273 reaching a multi-year low of 2,183.95 before buyers surfaced, steering the price back up towards the 2,350 area, where the flat Ichimoku lines are located. The short-term oscillators, although negative, reflect some strengthening in positive momentum. The MACD, in the negative zone, is below its red trigger line but looks to be moving back above it. The RSI, in the bearish region, is rising towards its neutral [..]

post-image

Technical Analysis – Tesla stock continues descent; retraces until the 76.4% Fibonacci

Posted on March 17, 2020 at 6:02 pm GMT

Tesla’s stock price has corrected from the all-time highs piercing below the 50- and 100-day simple moving averages (SMAs) to touch a nearly three-month low of 394.97, which is just below the 76.4% Fibonacci retracement of the up leg from 218.21 to 967.49, of 395.83. The whole aggressive down move, which began on February 19, seems to have stalled around the 76.4% Fibo of 395.83. That said the MACD, in the negative region, is currently declining below its red trigger [..]

Virus update: In the eye of the storm – Special Report

Posted on March 17, 2020 at 3:48 pm GMT

With world stocks collapsing and entire economies going into lockdown, everyone is wondering how much worse this crisis can get and how long it will last. In a nutshell, the situation will probably get worse before it gets better, both in financial markets and the real economy, as most of Europe and America are still far from ‘peak virus’. Ultimately, this shock will subside and given the overwhelming stimulus measures lately, the market rebound could be meteoric. However, we might [..]

post-image

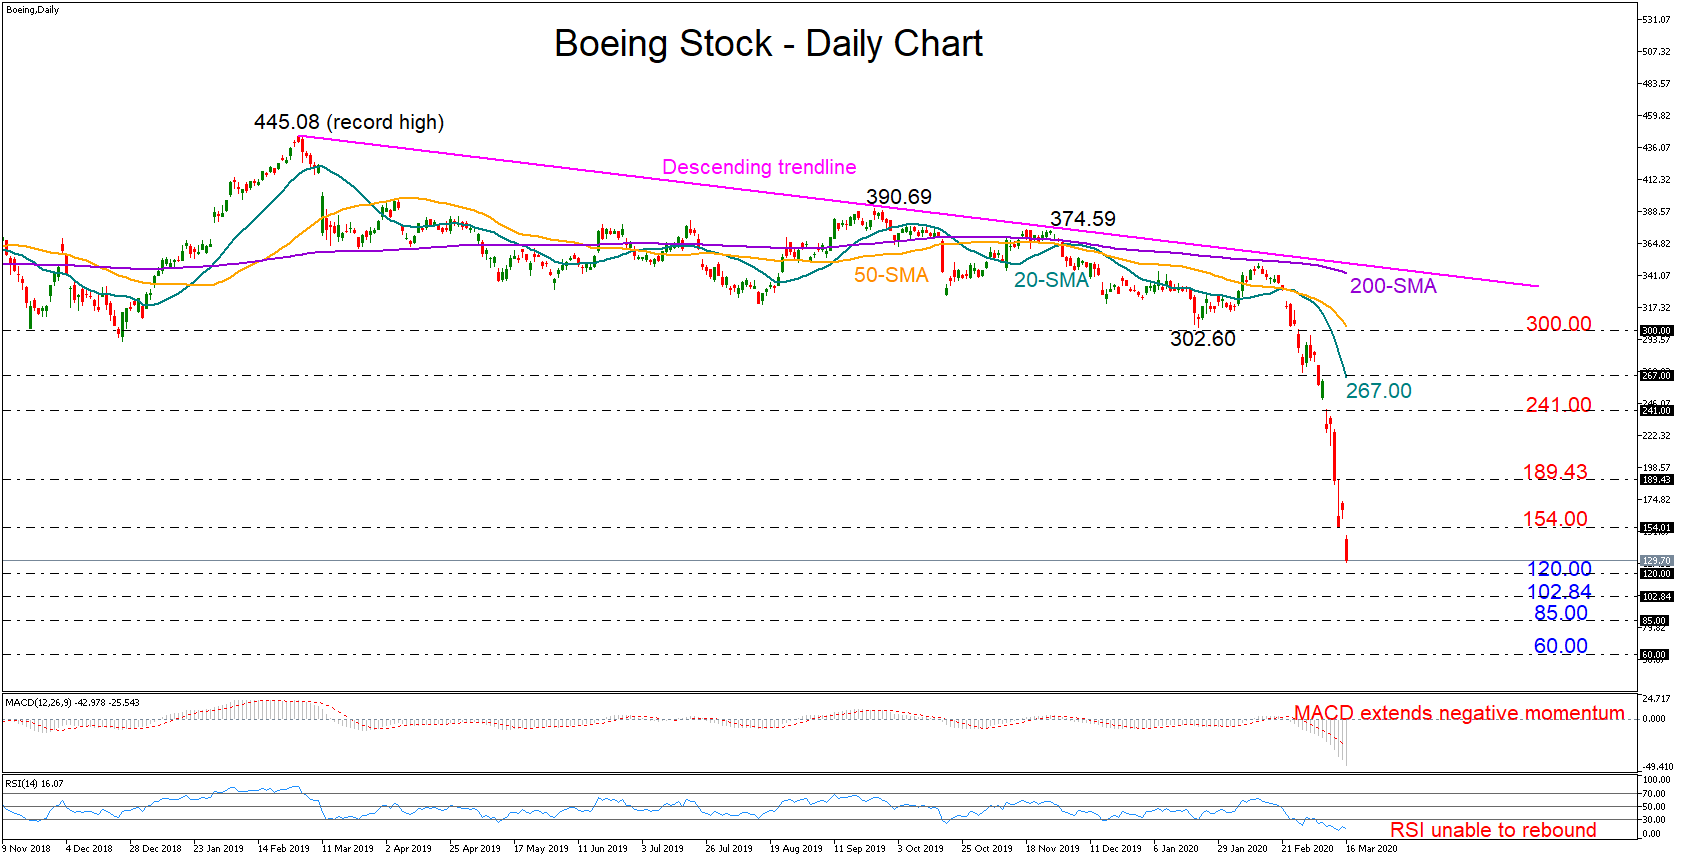
Technical Analysis – Boeing stock faces worst decline in history; eyes crucial support area

Posted on March 17, 2020 at 10:59 am GMT

Boeing’s stock price has faced its worst decline in history in the past three weeks. Besides the virus critical situation, the airplane designer was lately downgraded by the S&P rating agency, with its stock plunging to a fresh 3 ½ -year low of 127.90 on Monday. With technical indicators framing a bearish picture for the short-term as all simple moving averages are slipping downwards at a time the RSI and the MACD show no sign of improvement, traders are now eagerly waiting to see [..]

post-image

Technical Analysis – Netflix stock loses ground near to 3-month low; bearish bias

Posted on March 17, 2020 at 10:06 am GMT

Netflix stock price plummeted to a new three-month low of 292 during yesterday’s trading session, retaining the bearish movement that broke the medium-term ascending trend line. Also, the price has been developing beneath the flatten 200-day simple moving average (SMA), suggesting the start of a negative trend. In technical oscillators, the MACD is strengthening its bearish momentum below the zero line, while the RSI and the Stochastics are moving towards oversold levels, pointing to another negative session. Should the stock price stretch below December’s low of 292, immediate support could come [..]

Risk Warning: Your capital is at risk. Leveraged products may not be suitable for everyone. Please consider our Risk Disclosure.