XM does not provide services to residents of the United States of America.

Stock Market News

post-image

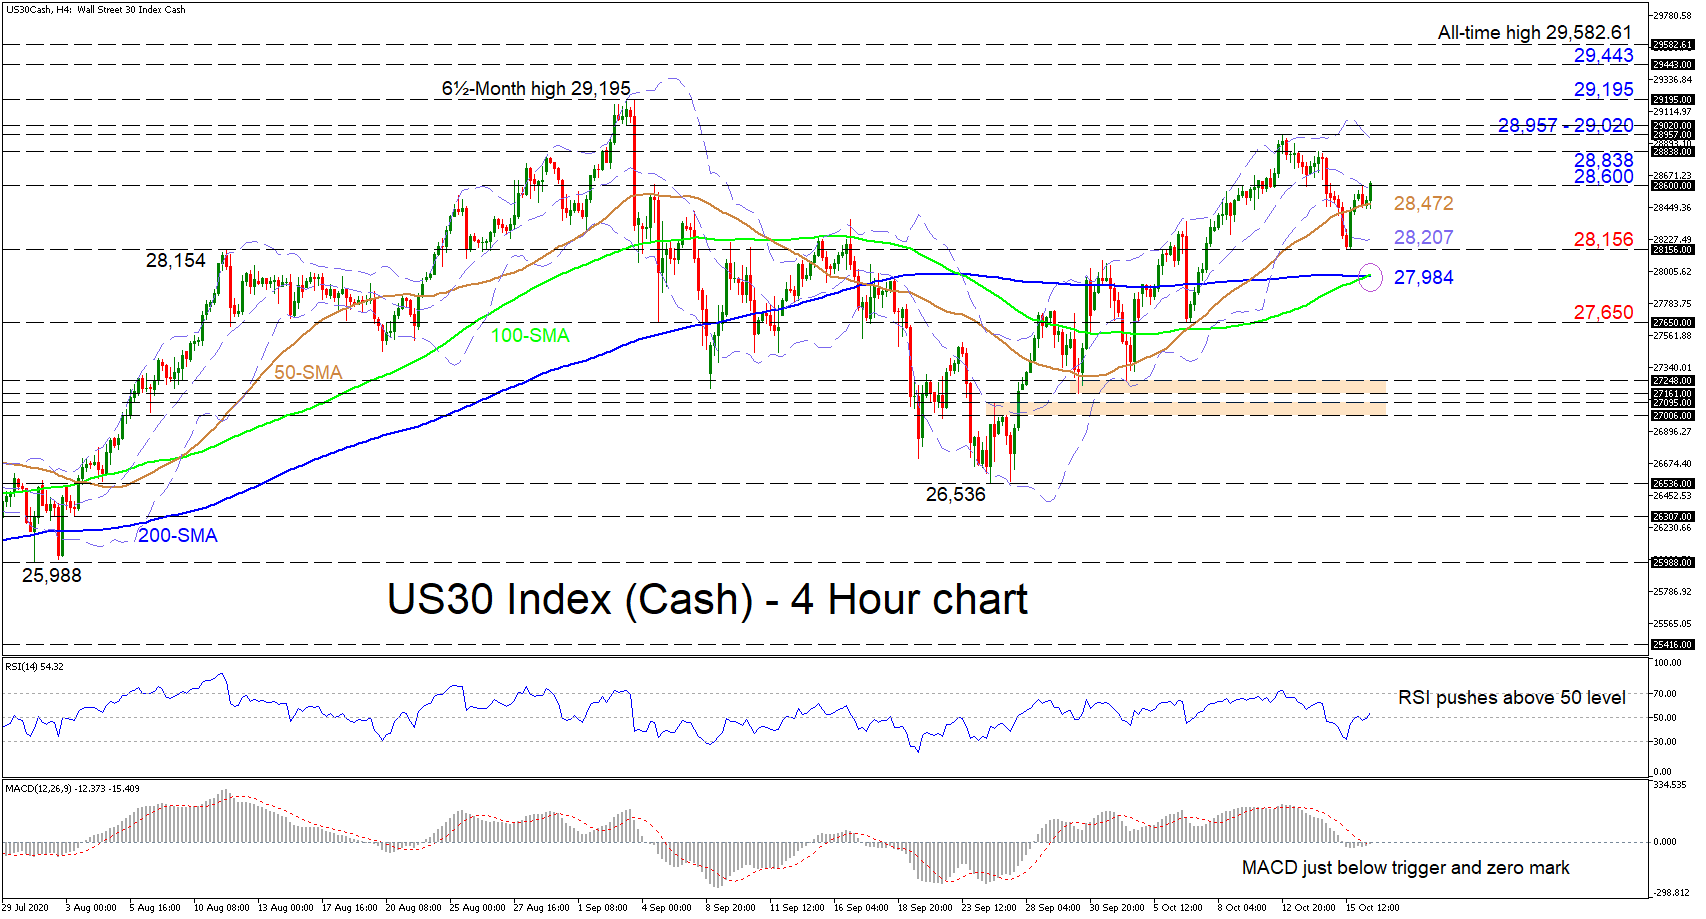
Technical Analysis – US 30 index struggles at mid-Bollinger band; positive signals grow

Posted on October 16, 2020 at 12:42 pm GMT

US 30 stock index (Cash) after having pushed above the 50-period simple moving average (SMA) is now confronting the mid Bollinger band at the 28,600 barrier. The index appears to be regaining strength after a pivot back up from the 28,156 mark. The rising slopes of the 50- and 100-period SMAs and the recent bullish crossover of the 200-period SMA by the 100-period one may boost the short-term uptrend. The short-term oscillators also reflect increasing positive momentum. The MACD, slightly [..]

post-image

Earnings season kicks off with big US banks – Stock Market News

Posted on October 13, 2020 at 3:18 pm GMT

The third-quarter earnings season is finally here, with a horde of major US banks releasing their results this week. Bank of America, Goldman Sachs, and Wells Fargo will all report on Wednesday before Wall Street’s opening bell, and their numbers will give us a sense of not just how the financial sector is doing, but also how the US consumer is faring. Overall, a lot of gloom has been priced into the banking industry, which in some cases may present [..]

post-image

Technical Analysis – JP 225 index continues to edge sideways; sentiment remains weak  

Posted on September 24, 2020 at 3:21 pm GMT

Japan 225 stock index (cash) has maintained a relatively horizontal structure despite weakening below all its simple moving averages (SMAs). The 50-period SMA is in the process of completing a bearish crossover of the 100-period SMA, while all SMAs are somewhat converging. The short-term oscillators also reflect a state of weakened directional momentum. The MACD is barely in the negative region and below its red trigger line, while the RSI hovers beneath the 50 threshold. That said, should the price [..]

post-image

Technical Analysis – Boeing stock testing crucial support region

Posted on September 23, 2020 at 1:40 pm GMT

Boeing’s shares have been grinding lower since June, albeit in a slow and controlled manner. The short-term price structure looks cautiously negative, as the stock has been printing lower highs and is trading beneath its 50- and 200-period simple moving averages (SMAs) on the four-hour chart, which seem ready to post a ‘death cross’. The silver lining is that there hasn’t been a lower low, as the 153.0 support zone has held strong so far. Short-term oscillators reflect this mildly [..]

post-image

Technical Analysis – Apple stock stabilizes after fierce correction

Posted on September 23, 2020 at 11:27 am GMT

Apple’s stock suffered a sharp drop in September, falling by more than 20% from its all-time highs before finding support near the 104.30 level and the lower Bollinger band. The price then rebounded somewhat, crossing back above the 50-day simple moving average (SMA), which is encouraging as it suggests this might have been just a correction after an explosive move higher since March. Momentum oscillators paint a mixed picture, with the RSI reflecting the latest recovery but the MACD continuing [..]

post-image

Technical Analysis – Tesla’s stock poised for more recovery ahead of battery event

Posted on September 22, 2020 at 1:41 pm GMT

Tesla’s stock has been nicely recovering the downfall that followed the company’s stock split in late August, crawling above the Ichimoku cloud in the four-hour chart and back into the 400 territory. Today’s battery event in California is expected to bring exciting news according to the CEO Elon Musk and questions are rising about whether the stock can rally towards its recent record high of 501.50. From a technical perspective, the short-term bias is viewed as positive, reflected by the [..]

post-image

Technical Analysis – Pinterest stock’s upside rally is fading, still bullish in medium term

Posted on September 17, 2020 at 12:47 pm GMT

Pinterest’s stock has been moving sideways above the Ichimoku cloud over the past two months, but in the medium-term picture it is still holding an upward direction, having printed a fresh record high of 39.31 on September 2. According to the MACD, positive momentum is fading as the indicator seems unable to climb back above its red signal line. The RSI is turning to the downside in the bullish zone, backing this view as well. In the positive scenario, where the price continues to expand above today’s [..]

post-image

Technical Analysis – UK 100 index struggles beneath cloud and negative trend line

Posted on September 14, 2020 at 1:49 pm GMT

UK 100 stock index (Cash) appears to be gradually fading below the very short-term descending line and the Ichimoku cloud. The flattened blue Kijun-sen line promotes a fairly sideways picture in the price, while the capping 50- and 100-day simple moving averages (SMAs) and the cloud’s lower surface suggest negative tensions may intensify in the index. That said, the upward sloping red Tenkan-sen line is reflecting current price attempts to develop further, while the RSI is climbing above its neutral [..]

post-image

Technical Analysis – US 30 index under negative strain; broader positive picture challenged

Posted on September 11, 2020 at 12:05 pm GMT

US 30 stock index (Cash) is flirting with the 200-period simple moving average (SMA) following a bounce off the 27,196 barrier, which was then capped by the 100-period SMA around 28,207. The retreat from the 6½-month high of 29,195 appears to maintain its waning negative tone, and may receive a boost from the forthcoming bearish crossover of the 100-period SMA by the 50-period one. That said, the merged Ichimoku lines are currently edging sideways reflecting a slowing pace in the [..]

post-image

Technical Analysis – US 500 index corrects sharply from fresh all-time high

Posted on September 7, 2020 at 1:19 pm GMT

US 500 index (Cash) recently plummeted from its new all-time top of 3,588, spiking below the 200-period simple moving average (SMA) until the 3,348 trough from August 20. It appears that negative pressures are abating, mirrored in the flattening of the Ichimoku lines and as price stalls. Furthermore, the short-term oscillators also suggest some subsiding in the negative picture. The stochastic oscillator appears to be strengthening. The MACD’s decline, in the negative region, seems to have started to ease, while [..]

Risk Warning: Your capital is at risk. Leveraged products may not be suitable for everyone. Please consider our Risk Disclosure.