XM does not provide services to residents of the United States of America.

Stock Market News

post-image

Technical Analysis – US 500 index looks optimistic despite minor retreat

Posted on January 11, 2021 at 1:58 pm GMT

The US 500 index (Cash) has retracted ever so slightly after stalling around the fresh all-time high of 3,831. Although the Ichimoku lines are revealing the ebbing in positive price action, the bullish demeanour of the simple moving averages (SMAs) is defending the positive structure. The withdrawal in price will have to mature into a deeper retracement to have any significant effect on the upwards drive. The short-term oscillators are transmitting mixed frequencies in directional sentiment. The MACD, in the [..]

post-image

Technical Analysis – JPMorgan’s stock advances to the highest since early 2020

Posted on January 7, 2021 at 10:54 am GMT

JPMorgan Chase & Co stock has made considerable progress towards its 2019 record highs over the past two months, printing its latest peak slightly below the 133.00 mark on Wednesday. The market, however, seems to be sailing in overbought waters according to the RSI, which is set to meet a key resistance area above 70. Hence, some stabilization around the 133.00 number, where the price action stalled several times in early 2020, is possible. If the rally extends beyond that barrier, [..]

post-image

Technical Analysis – Tesla’s stock roars to record year; bearish divergence seems in progress

Posted on December 31, 2020 at 11:33 am GMT

Tesla’s stock had undoubtedly one of its best years ever, making markets wonder how far the price can travel in uncharted territory, following its inclusion in the S&P 500 community. The electric-car maker has fully ignored the lockdown situation, claiming a 740% gain during 2020 and hitting a fresh record high of 696 in the last trading session of the year. Technically, the rally could see a continuation as the upward pattern shows no sign of reversal above its exponential moving averages (EMAs) and the [..]

post-image

Technical Analysis – US 30 index creeps to new all-time highs; positive momentum sluggish

Posted on December 18, 2020 at 1:28 pm GMT

The US 30 stock index (Cash) has logged a fresh all-time high of 30,345 as it continues to hold above the simple moving averages (SMAs), crawling gradually higher. The 200-period SMA is backing the positive structure, while the casual hike in the 50- and 100-period SMAs is maintaining the slow upwards pace in the index. Further backing this view is the relaxed incline in the Ichimoku lines. The short-term oscillators are reflecting weak momentum but lean towards the upside. The [..]

post-image

Technical Analysis – US 500 index gaps higher; holds all-time-high in its scope

Posted on December 14, 2020 at 3:05 pm GMT

The US 500 index (Cash) gapped above the 50-period simple moving average (SMA) today on the four-hour chart, re-establishing a positive bearing towards the upper Bollinger band and the recent all-time high of 3,715. The dictating bullish bearing in the SMAs remains robust even though the 50-period SMA’s upward pace is marginally easing. The short-term oscillators are reflecting a pickup in positive momentum. The MACD, above its red trigger line, is pushing over its neutral threshold, while the RSI is [..]

post-image

Technical Analysis – UK 100 index eases slightly but upside risks remain

Posted on December 9, 2020 at 4:16 pm GMT

The UK 100 index (Cash) seems to be fading from its newly formed nine-month high of 6,623 as positive momentum is losing steam. Nevertheless, the simple moving averages (SMAs) are maintaining their bullish tone, preserving the positive structure. That said, the short-term oscillators are suggesting a strengthening of the negative price action. The MACD, in the positive zone, is sliding underneath its red trigger line, while the RSI is falling in bullish territory. Moreover, the stochastic oscillator has adopted a [..]

post-image

Technical Analysis – US 30 index conveys confidence above MAs  

Posted on December 4, 2020 at 1:27 pm GMT

The US 30 stock index (Cash) is tiptoeing higher after finding traction off the 100-period simple moving average (SMA), attached to the lower surface of the Ichimoku cloud. Although the Ichimoku lines are fairly directionless, the red Tenkan-sen line is nudging the price marginally higher. The indices’ positive structure appears safeguarded above the support zone of 28,838-28,957 and is being defended by the improving trajectory of the SMAs. The short-term oscillators are echoing intact positive momentum. The MACD, slightly above [..]

post-image

Technical Analysis – Tesla’s bullish momentum shows signs of exhaustion

Posted on December 4, 2020 at 12:32 pm GMT

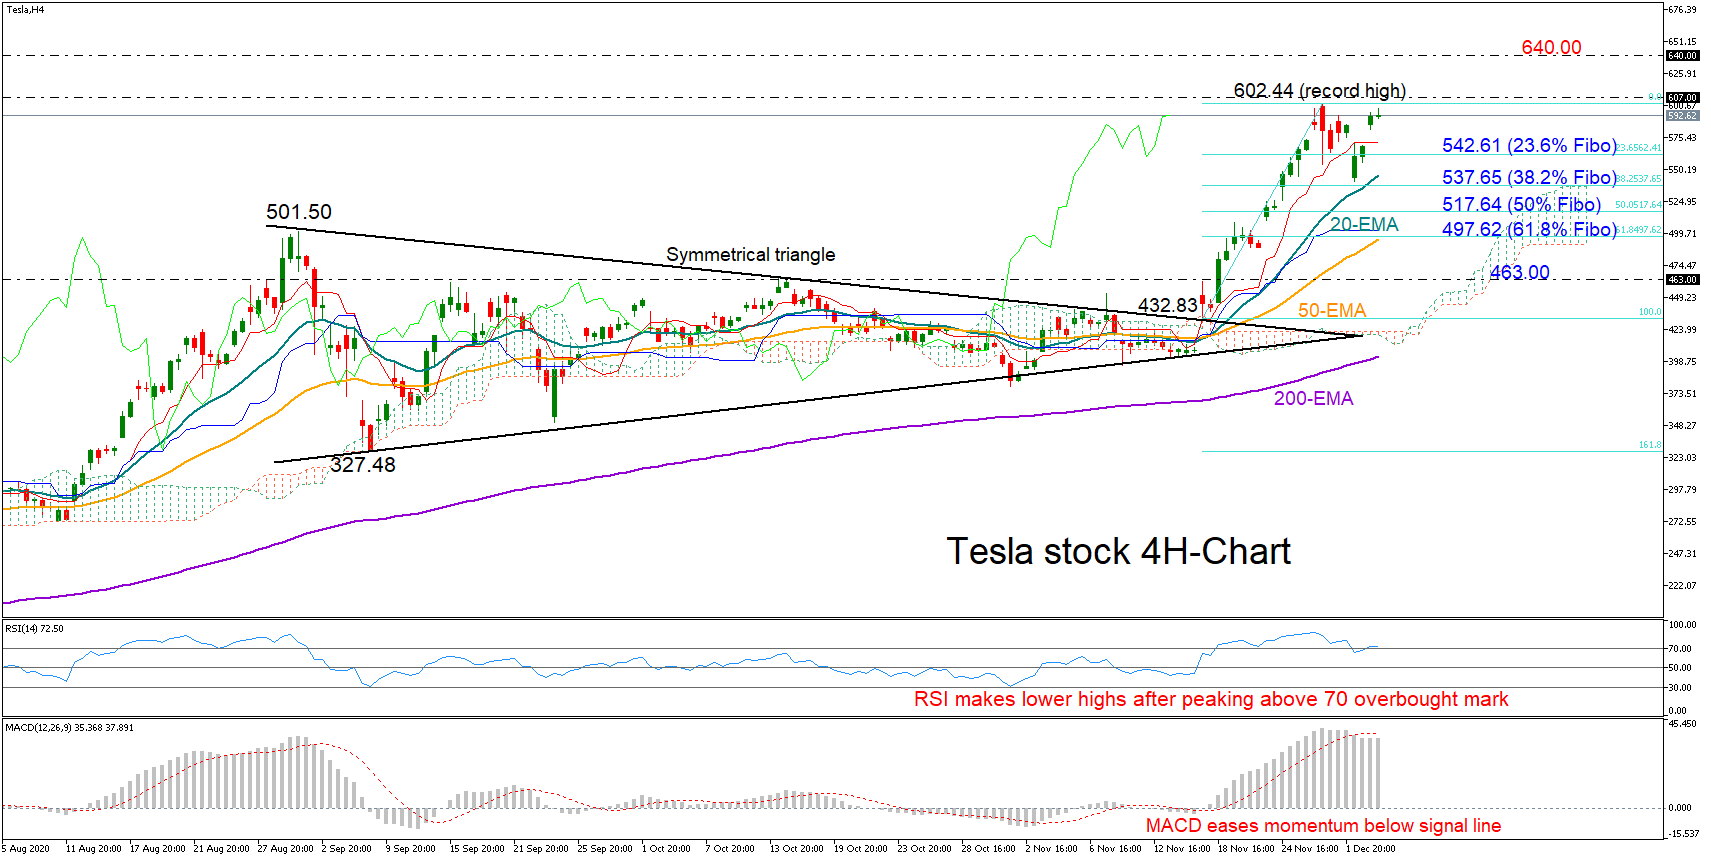
Tesla’s stock is seeking to re-challenge its record high of 602.44 having bounced from near the 20-period exponential (EMA) moving average in the four-hour chart. The RSI and the MACD, however, are questioning the positive appetite in the price as the former, although in the bullish area, seems to be printing a series of lower highs, while the latter is showing no strength below its red signal line. The above suggest some slowdown in the market, which could develop towards the 23.6% Fibonacci retracement of the [..]

post-image

Technical Analysis – US 500 index maintains positive bearing; momentum waning slightly

Posted on November 30, 2020 at 2:50 pm GMT

US 500 index (Cash) is consolidating just below its newly formed all-time high of 3,674, finding some stability from its red Tenkan-sen line, marginally below at 3,601. The simple moving averages (SMAs) are maintaining an unbroken bullish tone endorsing further advances. However, the flattening out of the blue-Kijun-sen line and the stalling in the climb of the red Tenkan-sen line are signalling near-term fading in the pair. The short-term oscillators suggest some easing in the upward momentum. The MACD is [..]

post-image

Technical Analysis – US 30 index retains bullish bias despite minor pullback   

Posted on November 27, 2020 at 1:37 pm GMT

US 30 stock index (Cash) has retreated ever so slightly from its freshly logged all-time-high of 30,213. Positive sentiment seems to be taking a breather as the index, to some degree, is nudging sideways. The bullish 50- and 100-day simple moving averages (SMAs) could boost the price, sending the index to uncharted peaks. The short-term oscillators are transmitting mixed messages in directional momentum. The MACD, in the positive region, is holding above its red trigger line, while the stochastic oscillator [..]

Risk Warning: Your capital is at risk. Leveraged products may not be suitable for everyone. Please consider our Risk Disclosure.