XM does not provide services to residents of the United States of America.

Stock Market News

post-image

Technical Analysis – US 500 index favours upside despite minor dwindling

Posted on February 8, 2021 at 1:03 pm GMT

The US 500 index (Cash) seems to be faintly stalling above the red Tenkan-sen line around 3,890, after touching a fresh all-time-high of 3,907. Nevertheless, the Ichimoku lines are retaining a bullish tone despite the marginal pausing in the blue Kijun-sen line, while the upwards creeping simple moving averages (SMAs) are nourishing improvements in the price. Yet, for negative pressures to gain strength, the index would need to retract below the 3,814 level, which happens to be the 38.2% Fibonacci [..]

post-image

Technical Analysis – UK 100 index retreats below 50-day SMA; upside risks remain

Posted on February 3, 2021 at 2:14 pm GMT

The UK 100 index (Cash) retraced significantly from its 10½-month high of 6,955, plunging underneath the 50-day simple moving average (SMA), only to rebound near the previous trough of 6,312. The positive picture in the index, currently curbed by the 50-day SMA at 6,578, is holding onto hopes of returning higher. Also strengthening this view are the SMAs, which are maintaining a bullish demeanour. The short-term oscillators reflect the recent bounce and continue to favour the upside. The RSI, slightly below [..]

post-image

Alphabet’s Q4 revenue set to top $50 billion but antitrust investigations mount – Stock Market News

Posted on February 2, 2021 at 7:25 am GMT

Google’s parent, Alphabet Inc, will report fourth quarter earnings numbers on Tuesday after Wall Street’s closing bell. The Internet search giant is expected to post a double-digit jump in revenue as the company continues to diversify its income stream away from online ads. However, antitrust investigations against the online behemoth are mounting, raising fears about a potential breakup of the business. However, while those concerns have been a drag on the stock, it is still up more than 4% so [..]

post-image

Technical Analysis – US 500 index’s bounce on cloud may reinforce uptrend  

Posted on February 1, 2021 at 2:12 pm GMT

The US 500 index (Cash) appears to be finding some footing off the upper surface of the Ichimoku cloud after its withdrawal from the all-time high of 3,867. Although the dipping red Tenkan-sen line is feeding negative price action, the climbing simple moving averages (SMAs) are safeguarding the ascent. For the retraction to begin to undermine positive belief, the pair would have to recede towards the 100-day SMA at 3,576. The short-term oscillators are reflecting conflicting signals in directional momentum. [..]

post-image

Technical Analysis – Google stock pauses below record high; bias titled to the upside

Posted on February 1, 2021 at 8:12 am GMT

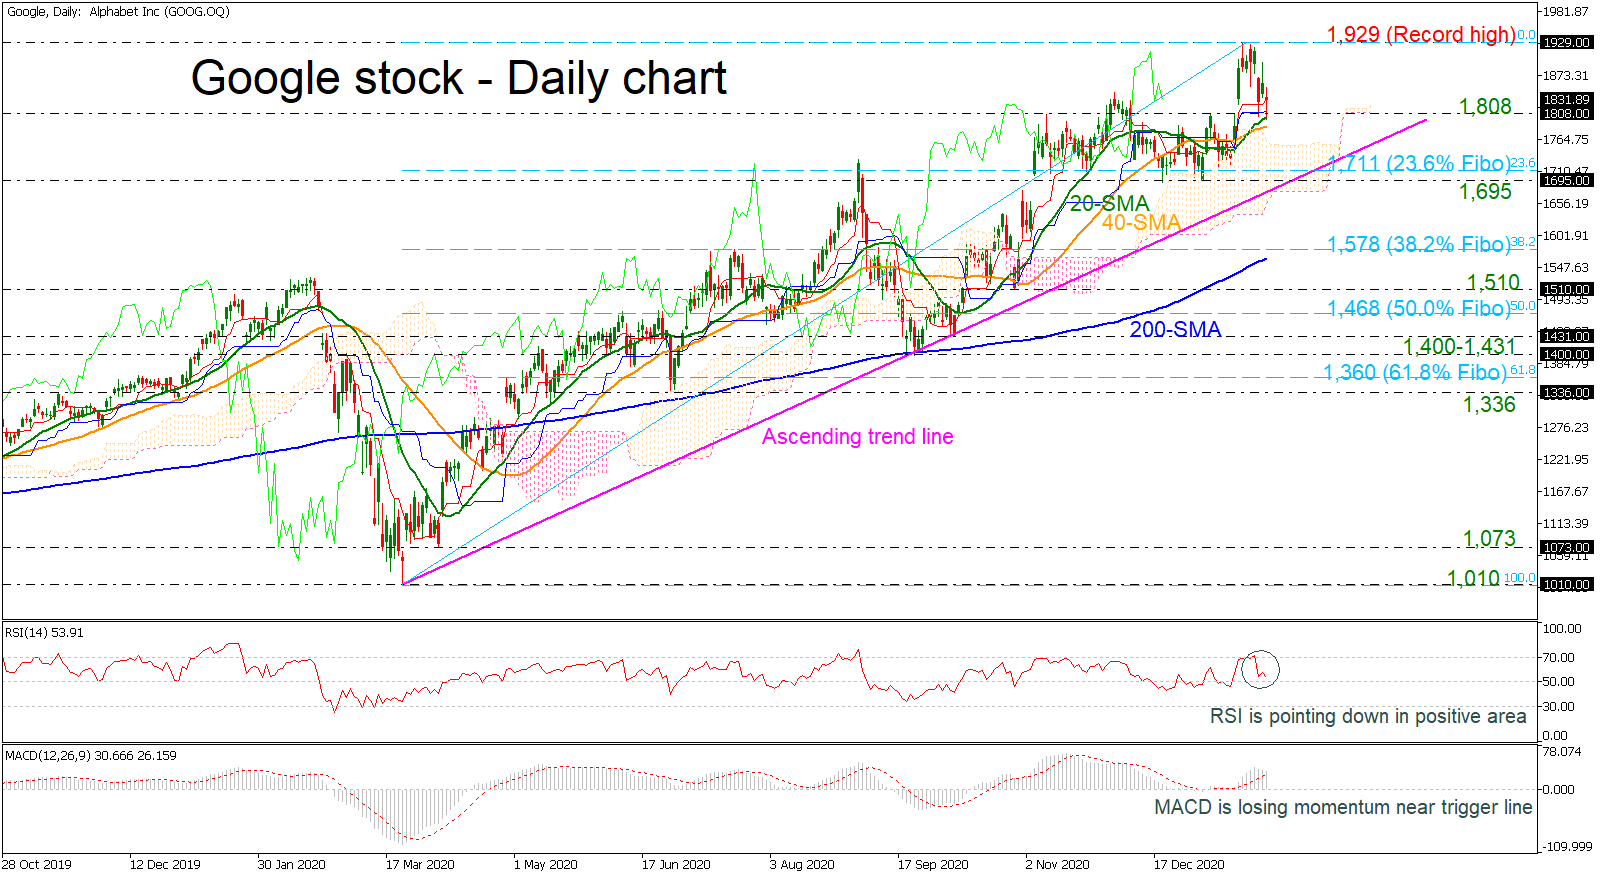
Google stock has been in a downside correction after the upward rally towards the all-time high of 1,929, touching the 20-day simple moving average (SMA). From a technical perspective, the short-term bias is viewed as negative, reflected by the descending move in the technical indicators. The RSI is pointing down in the positive territory, while the MACD is losing momentum near its trigger line and above the zero level. However, the 20- and 40-day SMA posted a bullish crossover and [..]

post-image

Technical Analysis – US 30 index’s pullback contested by 38.2% Fibonacci

Posted on January 28, 2021 at 3:23 pm GMT

The US 30 stock index (Cash) has found footing on the 30,047 level, which happens to be the 23.6% Fibonacci retracement of the up leg from 26,065 until 31,284, after receding from its latest all-time high of 31,284. Yesterday’s losses saw the index pierce below the 50-day simple moving average (SMA), last encountered in early November of last year, to only recoup most of them today with a bounce off the 23.6% Fibo. The rising SMAs are protecting the positive [..]

post-image

Technical Analysis – Apple stock suspends its gains; trend favours upside

Posted on January 27, 2021 at 11:56 am GMT

Apple’s stock price appears to have frozen slightly beneath the freshly formed all-time high of 145.00 after gapping, in previous sessions, above the former 138.71 peak. The rising red Tenkan-sen line is promoting positive price action, while the climbing simple moving averages (SMAs) are defending the bullish picture. The short-term oscillators are transmitting mixed signals in directional momentum even though the improving tone remains. The MACD, in the positive zone, is strengthening far above its red trigger line, while above [..]

post-image

Technical Analysis – Amazon stock creeps sideways, forming possible triangle pattern

Posted on January 26, 2021 at 3:40 pm GMT

Amazon stock has been fluctuating over the last four months after the aggressive correction from the all-time high of 3,545. The stock appears to be edging eastwards in a more confined horizontal channel, developing into a possible symmetrical triangle. The price’s latest push up is currently being controlled by the triangle’s upper boundary, which is overlapping with the 3,346-3,364 ceiling of the more recent range in the stock. The Ichimoku lines overall are backing the directionless tone of the stock, [..]

post-image

Technical Analysis – Facebook rises in descending triangle around 280 level

Posted on January 26, 2021 at 2:17 pm GMT

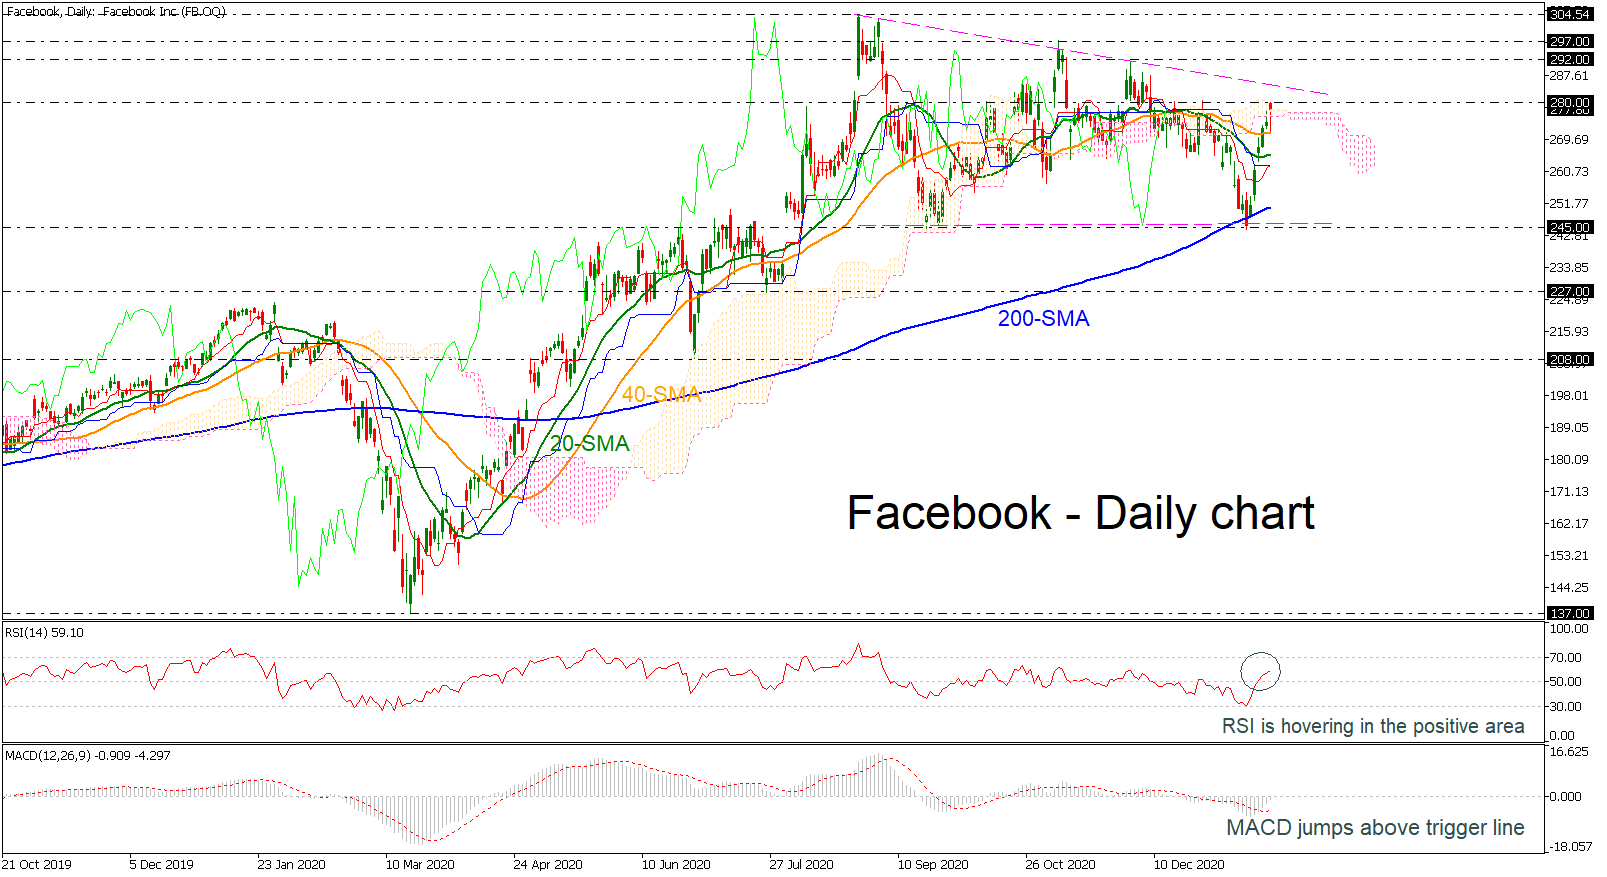
Facebook stock has been recovering nicely from the downfall to head towards the 245.00 support again, crawling near the Ichimoku cloud and back into the 280.00 territory in the daily chart. In the bigger view, the price has been developing within a descending triangle since August 2020. From a technical perspective, the short-term bias is viewed as slightly positive, reflected by the improvement in the RSI and the MACD. The RSI is heading north in the bullish area, while the MACD is increasing its distance above the trigger [..]

post-image

Technical Analysis – Tesla’s stock extends uptrend to uncharted zone

Posted on January 26, 2021 at 10:06 am GMT

Tesla’s stock resolved a bullish pennant formation on the upside on Monday in the four-hour chart, strengthening its March uptrend to a fresh record high of 899.88 before closing slightly below its previous peak. The bulls may keep pressuring for a close above the 900 level in the short run as the upward-sloping RSI has yet to confirm overbought conditions after violating its downward move. The MACD, although below its red signal line, is trying to regain some lost ground [..]

Risk Warning: Your capital is at risk. Leveraged products may not be suitable for everyone. Please consider our Risk Disclosure.