XM does not provide services to residents of the United States of America.

Stock Market News

post-image

Technical Analysis – Tesla bulls speed up towards January’s blocks

Posted on April 14, 2021 at 3:20 pm GMT

Tesla’s stock has finally claimed the tough resistance of 720.00 but another hurdle popped up around the 777.00 level on Wednesday. The area coincides with January’s swing low and the 23.6% Fibonacci retracement of the 432.83 – 899.98 rally; therefore it could be a tough obstacle to overcome. Nevertheless, neither the RSI nor the Stochastics have confirmed overbought conditions, and with the price having jumped above the Ichimoku cloud, the bulls may not easily abandon the game. If they successfully drive above 777.00, [..]

post-image

US Big Banks Q1 earnings: Will the rally resume? – Stock Market News

Posted on April 14, 2021 at 8:00 am GMT

The four biggest US banks will kick the earnings season this week, with JPMorgan Chase and Wells Fargo reporting their financial results for the first quarter of 2021 today followed by Bank of America and Citigroup on Thursday. The banking sector has drastically changed course from one of the worst-performing industries during the devastating 2020 year to a well-growing sector in early 2021. However, with the banks consolidating gains around record highs on Wall Street for several weeks now, investors would look for answers about [..]

post-image

Technical Analysis – US 500 index’s negative pressures threaten latest rally

Posted on April 12, 2021 at 8:23 am GMT

The US 500 stock index (Cash) has been improving steadily lately, although it appears the progress in the price may suffer a minor setback as increasing bearish forces are contesting the uptrend. The positive bias is being endorsed by the rising simple moving averages (SMAs), however, the short-term oscillators are promoting a slightly different picture. Currently, the oscillators are demonstrating that positive momentum is slightly waning, validating the marginal pullback in the price. The MACD is far above the zero [..]

post-image

Technical Analysis – US 100 index stabilizes marginally below record high

Posted on April 9, 2021 at 8:38 am GMT

The US 100 index is stabilizing around the record high of 13,904, pausing the strong upside tendency. The technical indicators, though, are sending mixed signals, suggesting that the softness in the market may not over yet. The RSI has turned lower near overbought levels, slightly below 70 indicating that the market could weaken a little bit in the short-term until the index falls below the 50 threshold. The MACD oscillator is gaining momentum above its trigger and zero lines. Should [..]

post-image

Technical Analysis – US 30 index takes a breather around 123.6% Fibonacci extension

Posted on April 8, 2021 at 3:44 pm GMT

The US 30 stock index (Cash) is currently edging sideways around the mostly neutral red Tenkan-sen line however, the bullish bias remains potent. The climbing simple moving averages (SMAs) are safeguarding the bigger bullish structure, while the relatively stable Ichimoku lines are reflecting a period of paused directional drive. The short-term oscillators are transmitting signals of waning positive momentum; however this is not sufficient to suggest a more aggressive pullback in the price. The MACD is still in the bullish [..]

post-image

Technical Analysis – US 30 index resumes bullish bias; upside risks improve

Posted on April 2, 2021 at 1:28 pm GMT

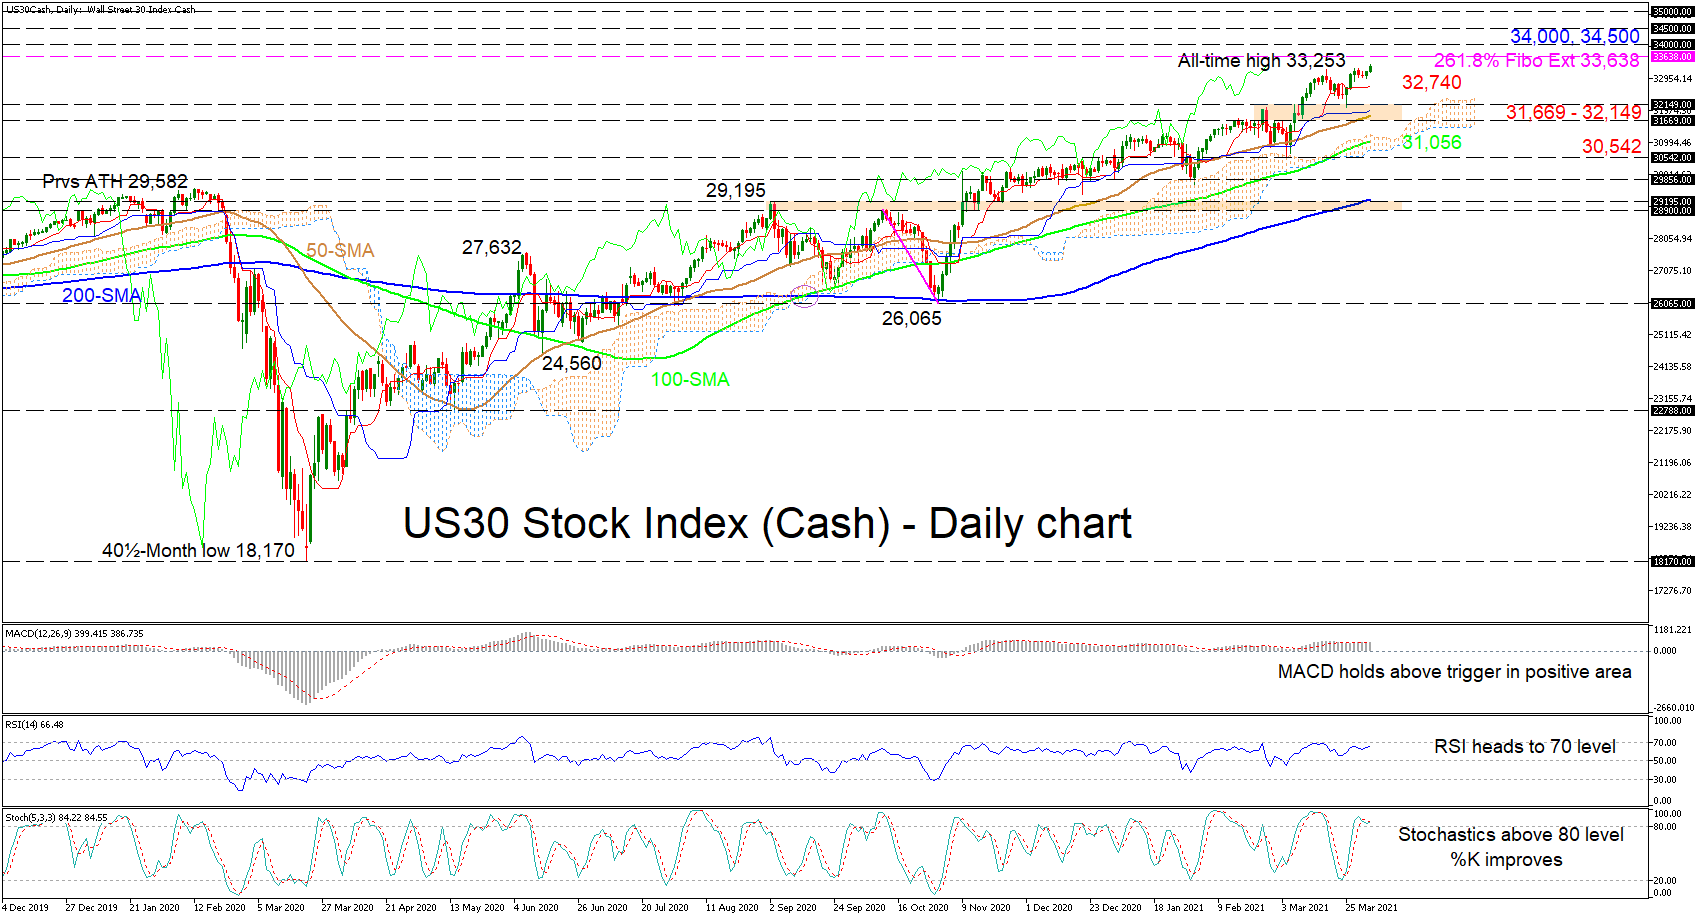
The US30 stock index (Cash) has currently crept over the all-time high of 33,253 and is headed for the 33,638 level, which happens to be the 261.8% Fibonacci extension of the down leg from 28,900 to 26,065. The sturdy advancing simple moving averages (SMA) are defending the bullish structure, while positive sentiment appears to be picking up. The Ichimoku lines are conveying the above mentioned view point – as are the short-term oscillators – and are starting to turn upwards [..]

post-image

Technical Analysis – US 30 index’s gains curbed by 32,800 mark and Ichimoku cloud

Posted on March 26, 2021 at 1:16 pm GMT

The US 30 stock index’s (Cash) recently found foothold at the 32,068 level has elevated its price into the vicinity of the 50-period simple moving average (SMA). In spite of this, instantly limiting additional price gains is the 32,800 barrier coupled with the cloud’s upper frontier. Regardless of the faded incline in the 50-period SMA – reflecting a slight setback in the up move – the rising 100- and 200-period SMAs are preserving the positive picture. The short-term oscillators are [..]

post-image

Technical Analysis – US 30 index resumes its climb to unmapped peaks

Posted on March 18, 2021 at 4:24 pm GMT

The US 30 stock index (Cash) is stepping up to fresh all-time highs, currently around 33,210, after its latest bounce off the Ichimoku cloud’s upper frontier at 30,542. The bullish Ichimoku lines are endorsing the recent positive sentiment in the index, while the advancing simple moving averages (SMAs) are safeguarding the bullish structure. Furthermore, the short-term oscillators are conveying encouraging signals in upside momentum. The MACD, in the positive region, is growing above its red trigger line, while the RSI [..]

post-image

Technical Analysis – US 30 index takes a breather; upside risks remain

Posted on March 12, 2021 at 1:27 pm GMT

The US 30 stock index (Cash) is retreating somewhat from its new all-time high of 32,660, which happens to be the 138.2% Fibonacci extension of the down leg from 32,073 until 30,542 – the latter being the trough where the one week rally pushed off from. The advancing simple moving averages (SMAs) are endorsing the positive picture in the index, while the bullish crossover of 100-period SMA by the 50-period one – with a freshly steepened inclined – is further [..]

post-image

Technical Analysis – Tesla’s stock exposed to bearish risks despite upturn

Posted on March 11, 2021 at 9:59 am GMT

Tesla’s stock has been in a recovery mode this week, healing its injuries from a three-month low of 539.00. On Wednesday, however, the electric car maker saw its efforts falling behind near the 50-period exponential moving average (EMA) on the four-hour chart despite crawling above the 700.00 mark. Although the RSI has violated its downward trend, it is still below its 50 neutral level and seems to be losing steam, flagging that bearish forces have not faded yet. Also, the price itself continues to endorse [..]

Risk Warning: Your capital is at risk. Leveraged products may not be suitable for everyone. Please consider our Risk Disclosure.