XM does not provide services to residents of the United States of America.

Stock Market News

post-image

Technical Analysis – US30 index uptick is not enough to alter its bearish outlook

Posted on March 17, 2022 at 8:28 am GMT

The US 30 index has witnessed an uptick over the last few trading sessions as the negativity in the price seems to be waning. However, the index continues to record a series of successive lower highs and lower lows, supporting an overall bearish outlook. Despite the bearish outlook, short-term momentum oscillators are reflecting a slightly positive bias as the RSI has recently crossed above its 50 neutral mark. Moreover, the MACD is found above its red signal line, although still [..]

post-image

Technical Analysis – JP225 index’s bias improves but the outlook remains bearish

Posted on March 16, 2022 at 11:43 am GMT

The JP 225 index continues its downtrend move, recording successive lower lows and lower highs as negative momentum lingers. Moreover, the index is currently trading well below its 50- and 200-day simple moving averages (SMAs), reinforcing the overall bearish outlook. Despite the bearish outlook, short-term oscillators are reflecting a positive bias as the RSI is increasing despite being below its 50 neutral mark. Also, although the MACD is below zero, it has recently crossed above its red signal line, which [..]

post-image

Technical Analysis – AMD stock records yet more lower highs as negativity lingers

Posted on March 16, 2022 at 8:49 am GMT

AMD stock is extending its descending trend, recording successive lower highs as negative forces linger. Moreover, the stock has recently crossed below the 200-day simple moving average (SMA) and continues to trade below its December downtrend line, supporting an overall bearish outlook. The short-term momentum oscillators are reflecting a mixed picture as the RSI is increasing despite being below its 50 neutral mark. However, the MACD is found below zero and its red signal line, which indicates that the negative [..]

post-image

Technical Analysis – Microsoft’s stock completes a ‘death cross’ as negativity persists

Posted on March 15, 2022 at 3:08 pm GMT

Microsoft’s stock continues its downtrend move, recording successive lower lows and lower highs as negative forces linger. Moreover, the 50-day simple moving average (SMA) has crossed below the 200-day SMA completing a ‘death cross’, reinforcing the thesis for a sustained bearish outlook. The short-term momentum indicators are reflecting a negative bias too as the RSI is located below its 50 neutral mark. Also the MACD is found below zero and its red signal line, which indicates that the negative momentum [..]

post-image

Agriculture stocks soar as the Ukraine war unfolds – Stock Market News

Posted on March 15, 2022 at 1:47 pm GMT

The ongoing Russian invasion of Ukraine has been rattling global markets over the past month, increasing fears that supply disruptions on commodities could haunt global economic growth. The recent increase in energy and food prices are stacking on top of the already staggering inflationary pressures, which could force central banks across the globe to take even more aggressive monetary policy tightening actions. This in turn raises the risk of choking off the global economic recovery, adding further downside pressures on [..]

post-image

Technical Analysis – UK 100 remains volatile amid an overall bearish outlook

Posted on March 14, 2022 at 2:27 pm GMT

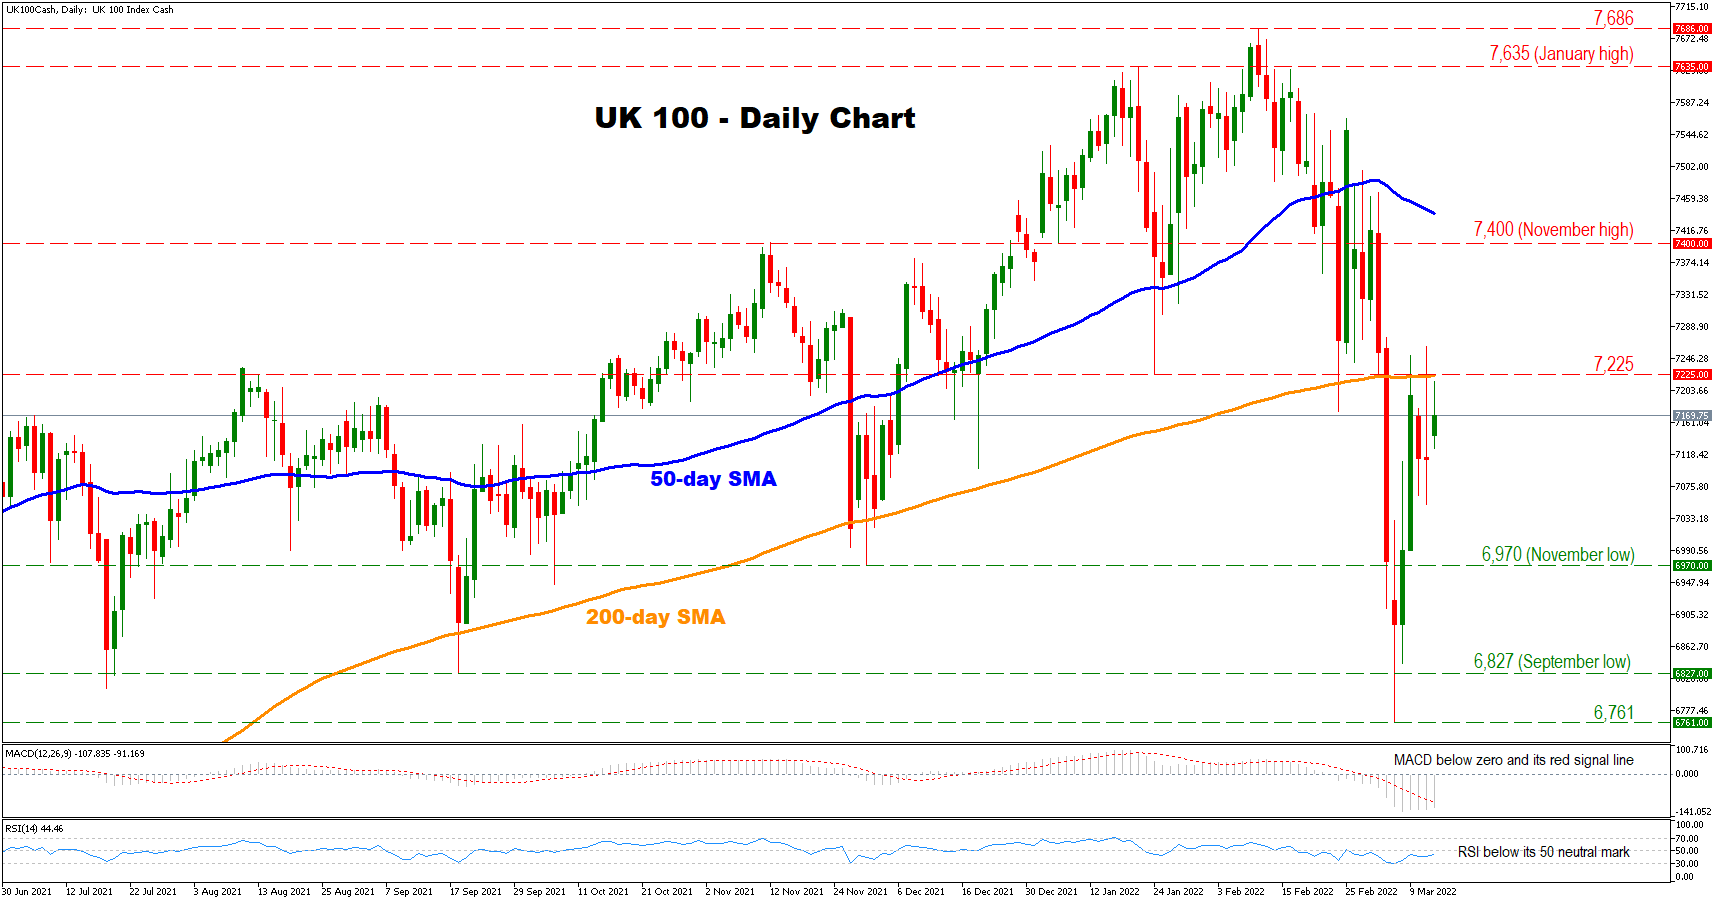
The UK 100 cash index has recouped some of its March losses during the last few trading sessions. However, this month’s violent losses have pushed the index below its 50- and 200-day simple moving averages (SMAs), reinforcing the thesis of an overall bearish outlook. The short-term momentum indicators are painting a negative picture too as the RSI is located below its 50 neutral mark. Also, the MACD is found below zero and its red signal line, which indicates that the [..]

post-image

Technical Analysis – US 500 index rangebound as bearish bias prevails

Posted on March 14, 2022 at 9:28 am GMT

The US 500 stock index (cash) has recovered some lost ground after its short-term decline ceased at the 4,150 region. However, in the last few four-hour sessions, its ongoing rebound seems to be faltering as the price has adopted a more sideways pattern. The momentum indicators suggest that bearish forces remain in charge. The RSI is flatlining in the negative zone, while the MACD histogram is found below both zero and its red signal line. Moreover, the price is trading beneath the [..]

post-image

Are cloud stocks the safest bet within the tech sector? – Stock Market News

Posted on March 11, 2022 at 12:53 pm GMT

In 2022, tech companies have come under significant pressure from multiple fronts. Firstly, they are struggling to sustain their pandemic-era financial figures, which enabled them to outperform the broader markets in 2021. Moreover, the upcoming monetary tightening is expected to negatively affect tech stocks as higher interest rates reduce the value of companies’ future cash flows while borrowing to promote growth becomes less attractive. In this adverse environment, where investors will be actively looking for the tech sector’s relative winners, can cloud stocks [..]

post-image

Technical Analysis – JP 225 index’s bearish bias intact despite fresh bounce

Posted on March 10, 2022 at 12:10 pm GMT

The JP 225 stock index (Cash) found its feet just before the 24,472 support, which extends back to October 2018, but upside pressures are struggling to overpower the prevailing negative mood in the index. The bearish simple moving averages (SMAs) continue to endorse the strong downward trajectory. Currently, the Ichimoku lines are indicating a pause in negative forces, while the short-term oscillators suggest bearish momentum has yet to fully subside. The MACD remains deep in the negative region and below [..]

post-image

Technical Analysis – US 30 index dives below SMAs in short-term

Posted on March 10, 2022 at 8:50 am GMT

The US 30 (cash) index failed again to touch the one-year low of 32,200 and returned higher but the near-term bias is still bearish. The 40- and the 200-day simple moving averages (SMAs) posted a death cross, confirming the bearish outlook. The RSI indicator is flattening below the 50 level, while the %K and the %D lines are ticking higher after the bullish cross. Further losses should see the latest low of 32,200 being tested before tumbling to the next support level of 30,530. If the [..]

Risk Warning: Your capital is at risk. Leveraged products may not be suitable for everyone. Please consider our Risk Disclosure.