XM does not provide services to residents of the United States of America.

Stock Market News

post-image

Major US banks kick off Q2 earnings season amid intensifying recession concerns – Stock Market News

Posted on July 12, 2022 at 2:56 pm GMT

As usual, the biggest US banks will unofficially kick-start the second quarter earnings parade, with JP Morgan Chase and Morgan Stanley reporting their financial results on Thursday before Wall Street’s opening bell, followed by Citigroup and Wells Fargo at the same time on Friday. This earnings season will gather a lot of attention as it will assess companies’ performance amid a continuously deteriorating macro environment, which has driven stock markets lower. For banks, an environment of rising interest rates should [..]

post-image

A glance at Q2 earnings amid inflation fears and growth jitters – Stock Market News

Posted on July 8, 2022 at 1:17 pm GMT

Next Thursday marks the beginning of the much awaited second quarter earnings season, which will indicate how companies fared during a turbulent period for markets amid soaring inflation, increasing supply disruptions, and significant changes in consumer spending. The explosive combination of elevated energy prices and the persistent supply woes are expected to have negatively impacted most firms’ profit margins, depending on their ability to pass on increasing costs to inflation-squeezed consumers. As concerns arise that recession remains around the corner, will the [..]

post-image

Technical Analysis – Goldman Sachs stock rangebound between 38.2%-50% Fibonacci

Posted on July 6, 2022 at 12:50 pm GMT

Goldman Sachs’ stock has been experiencing a sustained decline after peaking at the all-time high of 425.58 in October. Although the share price has been forming a clear structure of lower highs and lower lows, it has recently managed to cease its downfall and is currently trading within a range defined by the 38.2% and 50% Fibonacci projections of the 130.54-425.58 upleg. The momentum indicators are reflecting a bearish near-term bias. Specifically, the stochastic oscillator is descending sharply, while the [..]

post-image

Technical Analysis – JP 225 index declines steadily below SMAs

Posted on July 6, 2022 at 8:59 am GMT

JP 225 stock index (cash) has been experiencing a new wave of downside pressures after it recently failed to cross above the 27,280 region. Moreover, the price is currently trading beneath the Ichimoku cloud alongside both its 50- and 200-day simple moving averages (SMAs), endorsing a broader cloudy outlook. The short-term oscillators suggest that bearish forces have gained the upper hand. Specifically, the MACD histogram has crossed below its red signal line in the negative territory, while the RSI is [..]

post-image

Technical Analysis – JPMorgan stock tumbles to fresh 19-month low

Posted on July 5, 2022 at 12:09 pm GMT

JPMorgan’s stock has been trending downwards after peaking at the all-time high of 173.00 in October, generating a profound structure of lower highs and lower lows, while completely erasing its 2021 rally. Moreover, the price is currently trading well below the descending 50- and 200-day simple moving averages (SMAs), further endorsing the bearish technical picture. The momentum indicators suggest that selling pressure is intensifying. Specifically, the stochastic oscillator has fallen sharply after posting a bearish cross, while the RSI seems to be flatlining beneath its 50-neutral [..]

post-image

Technical Analysis – US 500 capped by 50-SMA; bias remains neutral

Posted on July 4, 2022 at 8:44 am GMT

The US 500 stock index (cash) has been trading sideways in the past week since its recent advance failed to cross above the 3,946 ceiling. Moreover, in the last few four-hour sessions, the price has been held down by its 50-period simple moving average (SMA) as positive momentum has failed to strengthen significantly. The momentum indicators are suggesting that bearish pressures are arising. Specifically, the stochastic oscillator is descending after posting a bearish cross, while the RSI is flatlining slightly [..]

post-image

How do Fed stress tests affect the outlook of the US banking sector? – Stock Market News

Posted on July 1, 2022 at 1:51 pm GMT

Last week, the Fed released the results of its annual bank stress tests, which are designed to evaluate each bank’s resiliency under an explosive cocktail of economic shocks that would lead to a deep recession. Specifically, the examined parameters entailed a 10% unemployment rate, a 40% decline in commercial real estate prices alongside a 55% collapse in major US equity indices. On the positive front, all 33 banks participating in the test appear to be able to withstand this severe [..]

post-image

Technical Analysis – Alibaba stock edges higher, eyeing its 200-SMA

Posted on June 28, 2022 at 3:02 pm GMT

Alibaba’s stock has been in a sustained downtrend for the past two years, generating a profound structure of lower highs and lower lows. Nevertheless, the price has been gaining ground in the past two months and is currently targeting the congested region which includes the 200-day simple moving average (SMA) and the upper Bollinger band. The momentum indicators suggest that bullish forces are holding the upper hand. Specifically, the stochastic oscillator has entered the 80-overbought area, while the RSI is [..]

post-image

Stock market themes to watch in the second half of 2022 – Stock Market News

Posted on June 24, 2022 at 1:34 pm GMT

As we are approaching the midway point of 2022, investors are assessing the performance of their stock portfolios in a year in which macroeconomic conditions have proved to be extremely unfavorable for risky assets. So far, mounting inflation, aggressive monetary tightening and increasing concerns over a global recession have dented investors’ risk appetite. This has led to a persistent sell-off in equity markets, with the S&P 500 and Nasdaq 100 both entering bear market territory. Therefore, investors are now trying to anticipate [..]

post-image

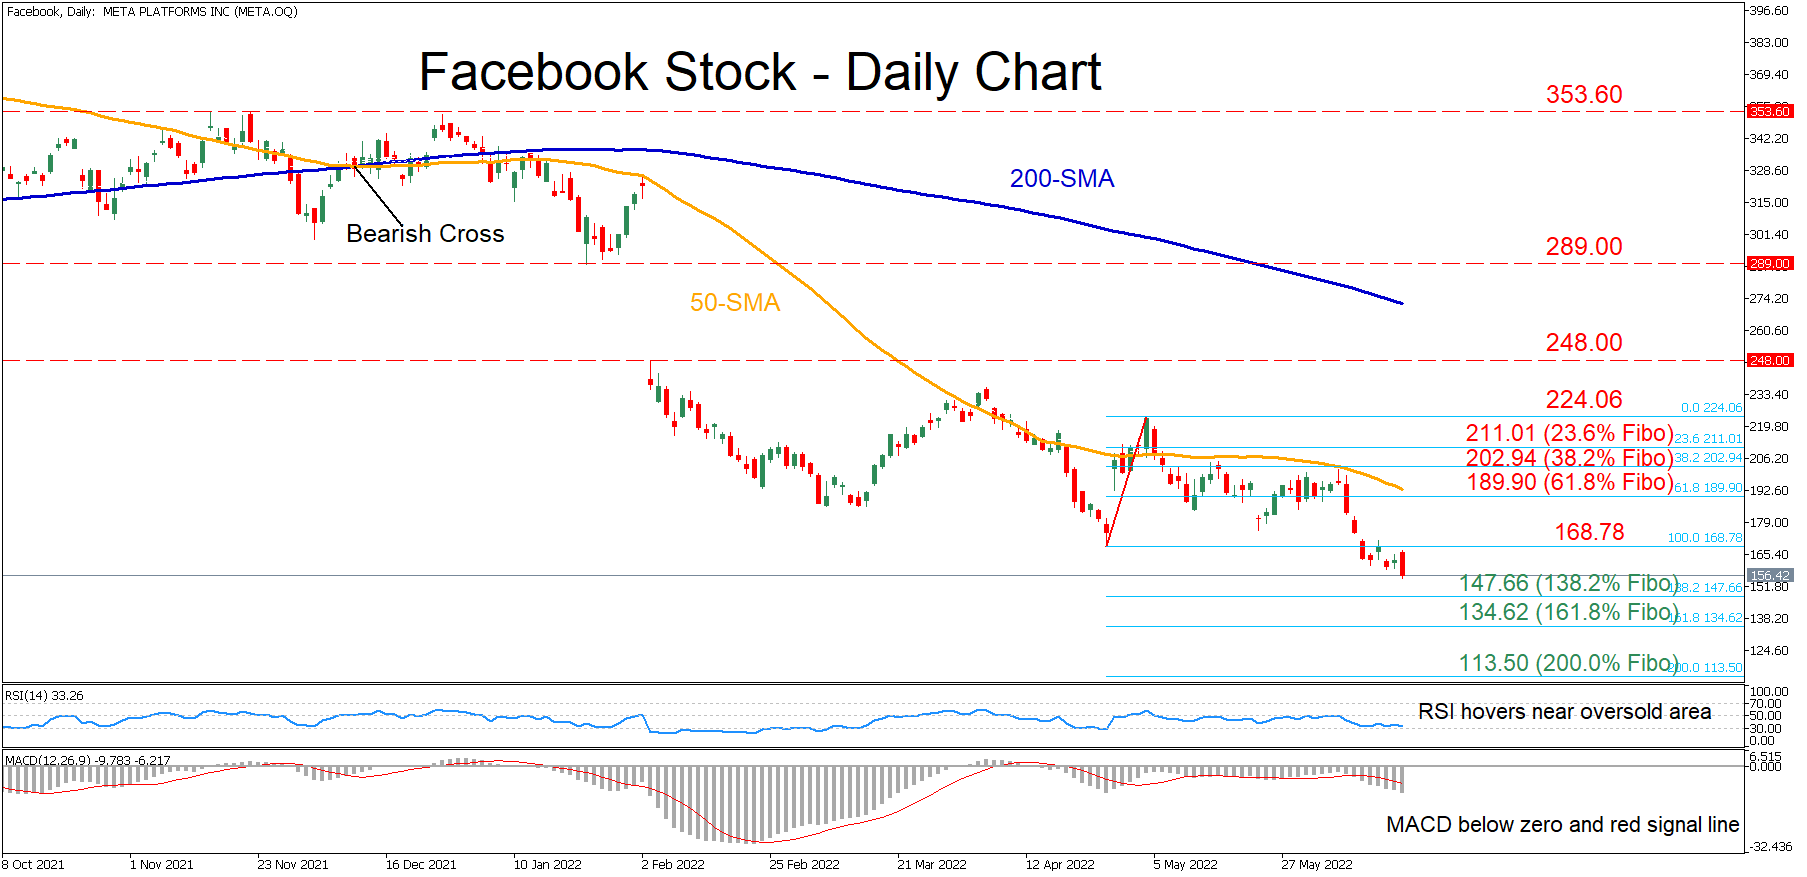
Technical Analysis – Facebook stock extends decline amid intensifying negative momentum

Posted on June 22, 2022 at 9:58 am GMT

Facebook’s stock has been inching lower in the long term, creating a profound structure of lower highs and lower lows. Additionally, the price is currently trading below the descending 50- and 200-day simple moving averages (SMAs), endorsing a broader negative short-term picture. The momentum indicators are depicting a bearish near-term bias. Specifically, the RSI is flatlining near the 30-oversold area, while the MACD histogram has dived beneath both zero and its red signal line. Should the negative momentum intensify, the price could descend towards [..]

Risk Warning: Your capital is at risk. Leveraged products may not be suitable for everyone. Please consider our Risk Disclosure.